


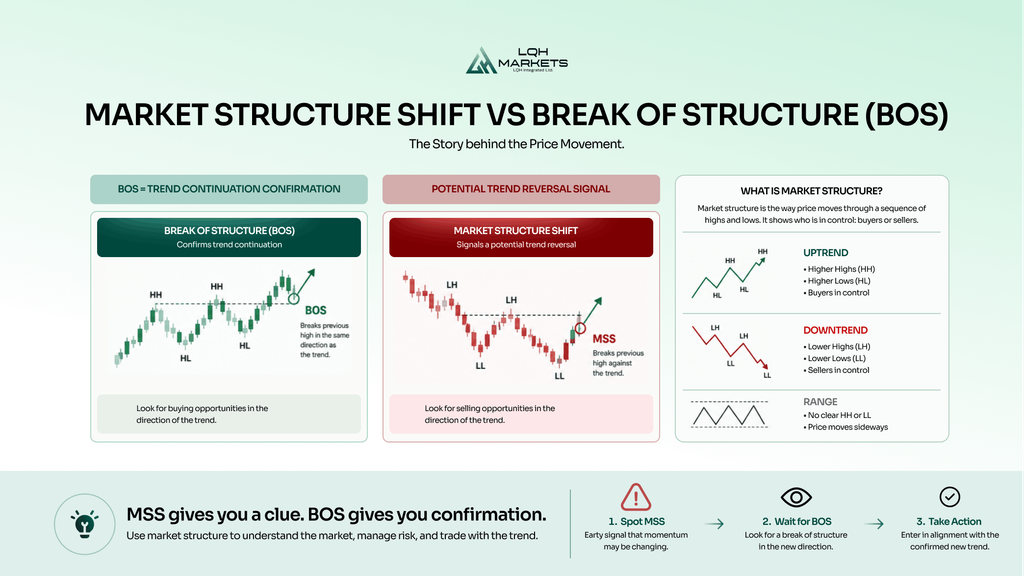
A Market Structure Shift (MSS) and a Break of Structure (BOS) are price action concepts traders use to understand whether a market is continuing its current trend or potentially reversing.
A Break of Structure (BOS) confirms that the existing trend is continuing by breaking a previous significant high or low in the same direction as the trend. A Market Structure Shift (MSS) signals that market momentum may be changing because price has broken the previous structure against the existing trend.
In simple terms:
- BOS = trend continuation confirmation
- MSS = potential trend reversal signal
Understanding the difference between these two concepts can help traders avoid entering trades too early, identify stronger setups, and better understand the relationship between buyers and sellers.
Watch our video guide explaining the difference between Market Structure Shift and Break of Structure:
Market Structure Shift vs Break of Structure: Key Differences
| Market Structure Shift (MSS) | Break of Structure (BOS) | |
| Main purpose | Identifies a possible trend reversal | Confirms trend continuation |
| Market behaviour | Existing trend starts weakening | Existing trend remains in control |
| Direction | Usually breaks against the current trend | Breaks in the same direction as the trend |
| Example | Downtrend breaks above a lower high | Uptrend breaks above a previous higher high |
| Trader interpretation | Buyers or sellers may be taking control | Buyers or sellers remain dominant |
Although MSS and BOS are often discussed together, they represent different stages of market behaviour.
A trader may first identify a Market Structure Shift as an early warning that momentum is changing, then wait for a Break of Structure in the new direction as confirmation.
What Is Market Structure in Trading?
Market structure describes how price moves through a sequence of highs and lows.
Technical analysts often use swing highs and swing lows to identify whether buyers or sellers are controlling the market.
A market generally exists in one of three conditions:
- Uptrend
- Downtrend
- Range
An uptrend occurs when price creates:
- Higher highs (HH)
- Higher lows (HL)
This means buyers are consistently pushing price higher, and pullbacks are finding support above previous lows.
A downtrend occurs when price creates:
- Lower lows (LL)
- Lower highs (LH)
This shows sellers are controlling momentum, with rallies failing below previous highs.
A range occurs when price moves sideways without creating a clear pattern of higher highs or lower lows.
Understanding market structure is a fundamental part of technical analysis because it provides context for potential entries and exits.
For example, a trader looking for long opportunities may prefer buying after a pullback within an established uptrend rather than attempting to predict a bottom during a falling market.
What Is a Break of Structure (BOS)?
A Break of Structure occurs when price breaks a previous significant swing high or swing low while continuing in the direction of the existing trend.
The purpose of BOS is confirmation.
Instead of trying to predict where price will move next, traders wait for the market to demonstrate that the current trend is still valid.
Bullish Break of Structure Example
Imagine a market moving higher:
- Price creates a higher high.
- Price retraces and forms a higher low.
- Price moves higher again and breaks above the previous high.
The break above the previous high creates a bullish BOS.
This suggests buyers remain in control and the uptrend may continue.
A trader may then look for opportunities to enter after a pullback rather than chasing the breakout.
Bearish Break of Structure Example
The opposite occurs during a downtrend:
- Price creates a lower low.
- Price retraces upwards and forms a lower high.
- Price falls and breaks below the previous low.
This creates a bearish BOS.
It suggests sellers are maintaining control and the bearish trend may continue.
Why Traders Use Break of Structure
BOS is popular because it provides confirmation that market momentum remains aligned with the current trend. However, a BOS should not be viewed as a guaranteed entry signal.
Markets frequently create false breakouts where price moves beyond a previous high or low before reversing.
This is why many traders combine BOS analysis with:
- Support and resistance
- Volume analysis
- Liquidity levels
- Risk management
- Multiple timeframe analysis
For example, a trader may identify a bullish BOS on a 15-minute chart but check the daily timeframe first to understand the larger market direction.
What Is a Market Structure Shift (MSS)?
A Market Structure Shift occurs when price breaks the existing market structure and suggests that control may be moving from buyers to sellers or vice versa.
Unlike BOS, which confirms continuation, MSS is often used as an early reversal indication.
The concept is closely related to the idea of a change in character (CHOCH), which is also commonly used in price action trading communities.
Bullish Market Structure Shift Example
Consider a market in a downtrend:
- Price creates lower lows and lower highs.
- Sellers remain in control.
- Price rallies and breaks above the previous lower high.
The break above the lower high may represent a bullish MSS.
The market has stopped following its previous bearish structure, suggesting buyers may be gaining strength.
However, traders often wait for further confirmation before entering.
A possible approach is:
- Identify the MSS.
- Wait for price to create a higher low.
- Look for a bullish BOS to confirm the new direction.
Bearish Market Structure Shift Example
A bearish MSS occurs when an uptrend begins losing control.
Example:
- Price creates higher highs and higher lows.
- Buyers continue driving price upward.
- Price falls below a previous higher low.
This break can signal that sellers are becoming more aggressive. The previous bullish structure has been damaged, creating the possibility of a larger reversal.
How Traders Combine MSS and BOS
Many traders use MSS and BOS together rather than relying on one concept alone.
A common approach looks like this:
Step 1: Identify the current trend
Determine whether the market is bullish, bearish, or ranging.
Step 2: Look for a Market Structure Shift
A break against the existing structure suggests that momentum may be changing.
Step 3: Wait for confirmation
A Break of Structure in the new direction provides additional evidence that control has changed.
Step 4: Plan the trade
Traders then consider:
- Entry point
- Stop loss placement
- Profit target
- Position size
This approach helps traders avoid entering immediately after the first sign of a possible reversal.
Common Beginner Mistakes With MSS and BOS
Mistaking Every Break for a Structure Break
One of the biggest mistakes beginners make is treating every move above a previous high or below a previous low as meaningful. Markets create small fluctuations constantly, especially on lower timeframes. A valid BOS or MSS usually focuses on significant swing points rather than minor price movements.
Ignoring Higher Timeframes
Market structure can look completely different depending on the timeframe.
For example:
A 5-minute chart may show a bullish MSS, while the daily chart is still in a strong downtrend.
This does not make the lower timeframe signal useless, but it changes the context.
Many traders use a top-down approach:
- Higher timeframe → identify overall direction
- Lower timeframe → find entries
Entering Immediately After a Break
Another common mistake is buying immediately after a bullish BOS or selling immediately after a bearish BOS.
Price often retraces after breaking structure.
Waiting for a pullback can provide:
- Better entry prices
- Smaller stop losses
- Improved risk-to-reward potential
Placing Stops Without Considering Structure
Market structure can also help traders decide where invalidation points should be.
For example:
A trader entering after a bullish BOS may place a stop below the most recent higher low.
If price breaks below that level, the bullish structure may no longer be valid.
This works alongside proper risk management, including tools such as our lot size calculator, which helps traders calculate appropriate position sizes before opening a trade.
You can also learn more about protecting trades with our guide on how to set stop loss and take profit in MT5.
Market Structure and Liquidity
Many traders combine BOS and MSS analysis with liquidity concepts. Liquidity refers to areas where large numbers of orders may exist.
Common liquidity areas include:
- Previous highs
- Previous lows
- Support and resistance levels
- Obvious breakout zones
For example, price may move above a previous high, triggering breakout traders, before reversing lower. This is why experienced traders avoid viewing a single structure break in isolation. Market context matters.
Which Timeframe Should Beginners Use?
There is no single best timeframe for analysing market structure.
The correct timeframe depends on the trader’s style.
Scalpers
Often analyse:
- 1-minute charts
- 5-minute charts
Short-term traders need to be aware that lower timeframes contain more market noise.
Our guide on 1-minute scalping strategy for beginners explores some of the considerations involved with short-term trading.
Day Traders
Often use:
- 5-minute charts
- 15-minute charts
- 1-hour charts
Swing Traders
Often focus on:
- 4-hour charts
- Daily charts
Traders exploring longer-term approaches can learn more about this style in our guide on is swing trading profitable.
Using Market Structure With Risk Management
Market structure can help traders identify potential opportunities, but risk management determines whether a strategy can survive over time. Even experienced traders have losing trades.
A structured approach includes:
- Risking an appropriate amount per trade
- Using logical stop-loss levels
- Avoiding emotional decisions
- Maintaining consistency
Poor risk management can turn a profitable strategy into an unsuccessful one. For example, increasing trade size after losses or moving stop losses further away can quickly increase risk.
You can learn more about managing trading psychology in our guides on how to stop revenge trading and how to stay consistent in trading.
Trading Market Structure Setups With MetaTrader 5
Market Structure Shift and Break of Structure analysis can be performed using charting platforms such as MetaTrader 5.
MetaTrader 5 provides traders with tools to:
- Analyse multiple timeframes
- Draw support and resistance levels
- Mark market structure points
- Execute and manage trades
- Use technical indicators
For beginners learning to identify BOS and MSS setups, practising on a demo account can help develop experience without risking real funds.
Once traders are comfortable with their strategy, they can explore opening a trading account and applying their approach in live markets.
Risk disclaimer
CFDs are complex instruments with a high risk of losing all your invested capital. Only trade with money you can afford to lose. Content is for general information only and is not investment advice.
Apply Market Structure Trading With LQH Markets
LQH Markets provides traders with access to MetaTrader 5 and a range of financial markets where strategies based on price action, technical analysis, and market structure can be applied.
Whether traders are analysing Break of Structure setups, identifying potential Market Structure Shifts, or testing new strategies, having access to reliable trading infrastructure and flexible account options can support their development.
Traders can practise their approach using a demo account, then transition to live markets through a trading account when they are ready.
With access to competitive trading conditions, multiple instruments, and tools designed for modern traders, LQH Markets provides an environment where traders can analyse markets and execute their strategies with confidence.
Ready to get started? Open a live LQH Markets account or start with a demo account.
Final Thoughts: MSS vs BOS Explained
Market Structure Shift and Break of Structure are useful concepts for traders who want to understand price action and market behaviour.
The key difference is simple:
- BOS confirms that the existing trend is continuing.
- MSS suggests that the existing trend may be changing.
Neither concept should be used as a standalone trading system. Successful traders combine market structure analysis with risk management, patience, and a clear trading plan.
By learning how price transitions between continuation and reversal phases, traders can develop a better understanding of why markets move and where potential opportunities may appear.
FAQ
What is the difference between a Market Structure Shift and a Break of Structure?
A Market Structure Shift (MSS) signals that the current trend may be losing momentum and a reversal could be forming. A Break of Structure (BOS) confirms that the existing trend is continuing after price breaks a significant swing high or swing low in the direction of that trend.
Is Market Structure Shift the same as Change of Character (CHOCH)?
Not always. Many traders use the terms interchangeably, while others consider a Change of Character (CHOCH) to be the initial break against the trend and a Market Structure Shift (MSS) to require additional confirmation. The exact terminology can vary depending on the trading methodology being used.
Which comes first: Market Structure Shift or Break of Structure?
In a potential trend reversal, a Market Structure Shift often appears first by indicating that momentum may be changing. Traders may then wait for a Break of Structure in the new direction to provide further confirmation before entering a trade.
Can beginners use Market Structure Shift and Break of Structure?
Yes. Both concepts are based on reading price action rather than relying on complex indicators, making them suitable for beginners. However, they should be used alongside sound risk management, multiple timeframe analysis, and a well-defined trading plan rather than as standalone trading signals.
Which timeframe is best for identifying Market Structure Shift and Break of Structure?
Market Structure Shift and Break of Structure can be identified on any timeframe, from one-minute charts to weekly charts. Day traders often analyse the 5-minute, 15-minute, and 1-hour charts, while swing traders typically focus on the 4-hour and daily timeframes. Many traders use higher timeframes to identify the overall trend before looking for entries on lower timeframes.