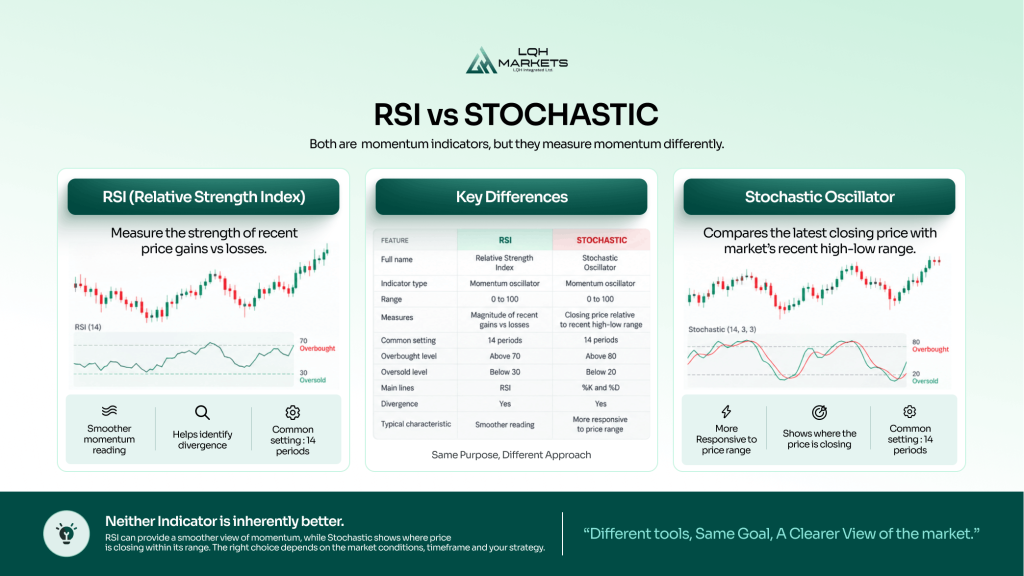
RSI and the Stochastic Oscillator are both momentum indicators, but they measure momentum differently. RSI compares the strength of recent price gains with recent price losses, while the Stochastic Oscillator compares the latest closing price with the market’s recent high-low range.
Neither indicator is inherently better. RSI can provide a relatively smooth view of momentum, while Stochastic is particularly useful for showing where price is closing within its recent range. The right choice depends on the market conditions, timeframe and trading strategy.
RSI vs Stochastic at a Glance
The biggest difference between RSI and Stochastic is what goes into their calculations.
| Feature | RSI | Stochastic Oscillator |
| Full name | Relative Strength Index | Stochastic Oscillator |
| Indicator type | Momentum oscillator | Momentum oscillator |
| Range | 0 to 100 | 0 to 100 |
| Measures | Magnitude of recent gains vs losses | Closing price relative to recent high-low range |
| Common setting | 14 periods | 14 periods |
| Common overbought level | Above 70 | Above 80 |
| Common oversold level | Below 30 | Below 20 |
| Main lines | RSI | %K and %D |
| Divergence | Yes | Yes |
| Typical characteristic | Smoother momentum reading | More responsive to position within price range |
Both indicators can highlight overbought and oversold conditions, momentum changes and divergence. However, because they calculate momentum differently, they do not necessarily produce the same signal at the same time.
What Is RSI?
The Relative Strength Index, or RSI, is a momentum oscillator that measures the magnitude of recent positive and negative price changes.
RSI was developed by J. Welles Wilder and displays momentum on a scale between 0 and 100.
The standard calculation uses 14 periods. RSI first compares average gains with average losses to calculate relative strength before converting that figure into the familiar 0 to 100 oscillator.
The simplified formula is:
RSI = 100 – [100 / (1 + RS)]
Where RS represents average gains divided by average losses over the selected period.
An RSI reading above 70 is traditionally considered overbought, while a reading below 30 is considered oversold.
These levels do not mean price must reverse.
A strongly trending market can remain above 70 or below 30 for an extended period. RSI is therefore also used to assess momentum, identify divergence and compare how momentum changes as price forms new highs and lows.
For example, RSI divergence can develop when price reaches a new high or low without RSI confirming the move, potentially indicating that momentum is weakening.
What Is the Stochastic Oscillator?
The Stochastic Oscillator is a momentum indicator that measures where the latest closing price sits relative to the market’s recent high-low range.
Instead of comparing the size of gains and losses, Stochastic asks a different question:
Is price closing near the top or bottom of its recent trading range?
The indicator is based on the principle that prices tend to close closer to the top of their recent range during upward momentum and closer to the bottom during downward momentum.
The Stochastic Oscillator normally contains two lines:
%K is the main Stochastic line and measures the current closing price relative to the selected high-low range.
%D is a moving average of %K and acts as a smoother signal line.
A common %K calculation is:
%K = [(Current Close – Lowest Low) / (Highest High – Lowest Low)] × 100
The calculation is normally made across a specified lookback period, commonly 14 periods.
Stochastic readings above 80 are traditionally considered overbought, while readings below 20 are considered oversold.
As with RSI, an overbought or oversold reading is not proof that a reversal is about to happen.
What Is the Main Difference Between RSI and Stochastic?
The main difference between RSI and Stochastic is what each indicator uses to measure momentum. RSI compares the strength of recent upward price changes with recent downward price changes, while Stochastic measures where the latest closing price sits within the market’s recent high-low range.
This difference affects how the indicators behave.
RSI answers a question similar to: How strong have recent gains been compared with recent losses?
Stochastic instead asks: Is the market closing near the top or bottom of its recent price range?
CME Group makes the same distinction in its technical analysis material, describing RSI in terms of the relationship between upward and downward closes while Stochastics measures the latest close relative to the high-low range over a selected period.
Consider a market that has traded between $90 and $100 during the previous 14 periods.
If it closes at $99, Stochastic will recognise that the latest close is near the top of that range. RSI approaches the same market differently by examining the magnitude of recent positive and negative price changes.
As a result, RSI and Stochastic can produce different readings even when applied to exactly the same price chart. They are both momentum oscillators, but they measure different characteristics of momentum.
RSI Overbought and Oversold vs Stochastic Overbought and Oversold
RSI and Stochastic both use overbought and oversold zones, but their standard thresholds are different.
For RSI:
Above 70: traditionally overbought
Below 30: traditionally oversold
For Stochastic:
Above 80: traditionally overbought
Below 20: traditionally oversold
An overbought reading means recent price behaviour has produced strong upward momentum according to the indicator’s calculation. It does not necessarily mean an asset is overpriced or that its price must fall.
Likewise, oversold does not automatically mean an asset is undervalued or that its price must rise.
This becomes particularly important during strong trends.
A market can repeatedly register overbought readings while continuing to make higher highs. Selling solely because an oscillator enters an overbought zone can therefore mean trading against strong momentum.
Looking at market structure alongside an oscillator can provide additional context about whether price is trending or ranging.
Which Is Faster: RSI or Stochastic?
The Stochastic Oscillator can appear more responsive because it tracks where the latest close sits within a defined high-low range, while RSI measures average gains and losses.
That responsiveness can be useful when traders want to monitor shorter-term shifts within a price range.
However, greater responsiveness is not automatically better.
An indicator that moves rapidly can produce more changes between overbought and oversold conditions. In a noisy market, that can create signals that disappear quickly or have little significance for the broader trend.
A smoother momentum reading may provide fewer potential signals but can make broader momentum easier to interpret.
The appropriate level of sensitivity therefore depends on what the trader is trying to measure.
Is RSI or Stochastic Better for Trending Markets?
Neither RSI nor Stochastic should be assumed to produce reliable reversal signals simply because a market is trending and the indicator reaches an extreme.
During an uptrend, RSI can remain elevated for a prolonged period. Stochastic can similarly remain around its upper range while price continues making higher highs and higher lows.
This is where analysing the indicator in the context of the trend becomes important.
For example, a trader might first establish whether price is forming the higher highs and higher lows associated with bullish market structure. RSI can then provide information about whether momentum remains strong or is beginning to weaken.
Stochastic can instead provide a more direct view of where each close sits within its recent range.
Neither approach turns an oscillator into a reliable prediction of when a trend will end.
Is RSI or Stochastic Better for Sideways Markets?
Both RSI and Stochastic can be useful for analysing range-bound markets because oscillators are designed to show changes in momentum within a defined scale.
Stochastic can be particularly intuitive in this environment because its calculation directly measures the position of price within its recent range.
If price repeatedly moves between established support and resistance, Stochastic may move towards its lower range as price approaches the bottom and towards its upper range as price approaches the top.
RSI can provide similar overbought and oversold information but calculates it from the strength of recent gains and losses rather than price’s location within the range.
However, neither indicator knows that support or resistance will hold.
If price breaks out of the range and begins trending, an oscillator can remain at an extreme while the breakout continues.
RSI vs Stochastic Divergence
Both RSI and Stochastic can produce divergence when the indicator and price move in different directions.
For example, bullish divergence can occur when price forms a lower low but the oscillator forms a higher low.
Bearish divergence can occur when price forms a higher high but the oscillator forms a lower high.
The interpretation is similar in both cases: momentum is no longer confirming the latest price extreme.
However, the underlying information is different.
RSI divergence compares price behaviour with changes in the strength of recent gains and losses. Stochastic divergence compares price with changes in where the market is closing within its recent range.
Neither form of divergence guarantees that price will reverse.
A trader may therefore wait for price itself to provide additional evidence, such as a break of an important swing level or a market structure shift, before treating divergence as confirmation of a reversal.
RSI vs Stochastic Crossovers
Crossovers play a much larger role in the Stochastic Oscillator because Stochastic normally contains two lines.
The %K line is the faster line, while %D is a smoothed version of %K.
A %K move above %D may be interpreted as increasing bullish momentum, while a move below %D may indicate weakening momentum.
Some traders pay particular attention to these crossovers when they occur around the traditional 80 and 20 zones.
Standard RSI normally consists of a single line, so there is no equivalent %K/%D crossover.
Traders can add moving averages to RSI or watch RSI crossing levels such as 30, 50 and 70, but these are different techniques from the traditional Stochastic crossover.
Can You Use RSI and Stochastic Together?
RSI and Stochastic can be used together, but traders should be careful about treating agreement between them as completely independent confirmation.
Both are momentum oscillators derived from the same underlying price data.
For example, if RSI shows an overbought reading while Stochastic is also above 80, it may look as though two separate pieces of evidence support the same conclusion.
In reality, both indicators are responding to strong recent price behaviour using different calculations.
Adding more indicators that measure broadly similar characteristics does not necessarily add more useful information.
An alternative is to combine a momentum oscillator with a different form of analysis.
For example, a trader might use RSI to assess momentum while using price structure to determine trend direction and important swing levels. This combines two different types of information rather than relying on multiple momentum readings.
RSI vs Stochastic RSI: Are They the Same Comparison?
No. The Stochastic Oscillator and Stochastic RSI are different indicators.
This distinction is important because the names are similar.
Stochastic Oscillator: applies a stochastic calculation directly to price.
Stochastic RSI, or StochRSI: applies a stochastic calculation to RSI values.
Fidelity describes Stochastic RSI as an oscillator that uses RSI values rather than price values as the inputs for the Stochastic formula.
StochRSI therefore measures where the current RSI sits relative to RSI’s own recent high-low range.
Its formula is:
StochRSI = [(Current RSI – Lowest RSI) / (Highest RSI – Lowest RSI)] × 100
This extra calculation makes StochRSI more sensitive than standard RSI. Fidelity notes that StochRSI reaches overbought and oversold levels more frequently than RSI and can also reach the extreme values of 0 and 100.
So:
RSI vs Stochastic compares two separate momentum indicators.
RSI vs Stochastic RSI compares RSI with an indicator calculated from RSI itself.
They should not be confused.
RSI vs Stochastic vs Stochastic RSI
The three indicators can be summarised as follows:
| Indicator | What does it measure? | Typical zones | Relative characteristic |
| RSI | Strength of recent gains vs losses | 70/30 | Smoother momentum oscillator |
| Stochastic | Close relative to recent price range | 80/20 | Responsive to position within range |
| Stochastic RSI | RSI relative to its recent RSI range | 80/20 | More sensitive oscillator |
Stochastic RSI’s increased sensitivity can be useful when a trader wants to identify smaller changes in momentum.
The trade-off is that greater sensitivity also means the indicator reaches extremes more frequently.
This is why choosing an indicator should not simply be a question of which one produces a signal first.
Which Indicator Is Better for Scalping?
RSI and Stochastic can both be applied to short-term charts, but neither is automatically the best indicator for scalping.
Stochastic’s responsiveness can make it attractive to traders monitoring short-term price movements. RSI can provide a smoother assessment of momentum and may produce fewer changes between extreme readings.
The shorter the timeframe, however, the more market noise can influence both indicators.
A one-minute chart contains far more short-term fluctuations than a daily chart. Oscillator signals can therefore appear and disappear quickly.
This is one reason scalping strategies commonly combine momentum analysis with trend direction, support and resistance, predefined stop losses and position sizing rather than relying on a single oscillator.
Which Indicator Is Better for Swing Trading?
Both RSI and Stochastic can also be used for swing trading, where positions may be held across multiple sessions.
RSI may suit traders looking for a relatively smooth view of momentum across larger price swings, while Stochastic can help show where price is closing within its recent trading range.
The holding period does not determine which indicator will be more accurate.
A swing trading strategy still needs defined entry and exit rules, risk controls and an understanding of the market conditions in which its signals are intended to work.
A useful indicator is therefore one that provides information relevant to a defined trading process, not simply the indicator that generates the largest number of potential setups.
What Settings Are Commonly Used for RSI and Stochastic?
A 14-period setting is commonly used as the default starting point for both RSI and Stochastic, although their complete settings differ.
A standard RSI might use:
RSI period: 14
Overbought: 70
Oversold: 30
A Stochastic Oscillator might use:
%K period: 14
%K slowing: 3
%D period: 3
Overbought: 80
Oversold: 20
Different charting platforms can use different defaults, particularly for fast, slow and full versions of Stochastic.
Changing the lookback period also changes the indicator’s behaviour.
A shorter period generally makes an oscillator more responsive to recent price changes, while a longer period smooths its movements.
There is no universal setting that makes either RSI or Stochastic more accurate across every asset, timeframe and market environment.
RSI or Stochastic: Which Is Better?
Neither RSI nor Stochastic is universally better because the indicators measure momentum differently.
RSI may be more useful when a trader wants to assess the strength of recent upward price changes relative to downward price changes. Stochastic may be more useful when the trader specifically wants to understand where price is closing within its recent high-low range.
The choice can therefore be based on the question being asked:
Use RSI when asking:
How strong have recent gains been compared with recent losses?
Use Stochastic when asking:
Where is price closing within its recent trading range?
Neither indicator should be selected simply because it produces more signals. A more responsive oscillator can identify momentum changes sooner but can also produce more short-lived signals.
Market conditions matter as well. CME Group notes that oscillators are commonly used in non-trending markets and can give misleading signals when a strong trend becomes established.
Whichever indicator is used, overbought, oversold, crossover and divergence signals should therefore be interpreted alongside price rather than treated as predictions of the market’s next direction.
Using RSI and Stochastic With LQH Markets
RSI and the Stochastic Oscillator are available as technical indicators within MetaTrader 5, allowing traders to compare momentum with price action across different chart timeframes.
LQH Markets provides access to MT5 for trading across forex, indices, commodities, stocks and cryptocurrencies. Traders can analyse RSI, Stochastic and other technical indicators alongside price charts and market structure before deciding whether a setup meets their trading rules.
A demo account can also be used to compare how the two indicators behave across different markets and conditions before applying a strategy with capital at risk.
Ready to get started? Open a live LQH Markets account or start with a demo account.
Risk disclaimer
CFDs are complex instruments with a high risk of losing all your invested capital. Only trade with money you can afford to lose. Content is for general information only and is not investment advice.
RSI vs Stochastic FAQs
Stochastic is not inherently better than RSI. RSI measures the strength of recent gains relative to losses, while Stochastic measures where price closes within its recent high-low range. Which is more useful depends on the strategy, market conditions and information the trader wants from the indicator.
There is no universal evidence that RSI or Stochastic is more accurate across every market and timeframe. Their calculations measure different aspects of momentum, and both can produce false signals. Accuracy therefore depends on the trading rules, market environment and how the indicator is interpreted.
Yes, RSI and Stochastic can be used together, but both are momentum oscillators derived from price. Agreement between them should not automatically be treated as two independent confirmations. Traders may instead combine one momentum oscillator with price structure, trend or another form of analysis.
RSI measures momentum by comparing recent gains with recent losses. Stochastic RSI applies the Stochastic formula to RSI itself, measuring where the current RSI sits within its recent RSI range. Stochastic RSI is therefore more sensitive and typically reaches overbought and oversold levels more frequently than standard RSI.
Both can be used for day trading. Stochastic may react more quickly to changes in where price closes within its recent range, while RSI generally provides a smoother momentum reading. Neither guarantees better day-trading results, and short-term signals should be assessed alongside price action and risk management.