
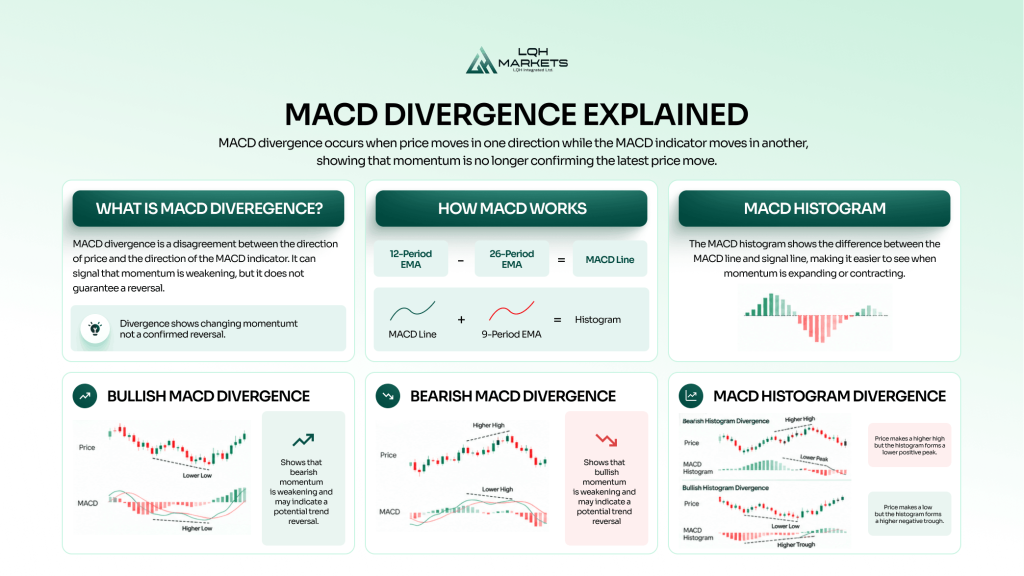
MACD divergence occurs when price moves in one direction while the Moving Average Convergence Divergence (MACD) indicator moves in another, showing that momentum is no longer confirming the latest price move. Bullish MACD divergence occurs when price makes a lower low while MACD makes a higher low, while bearish MACD divergence occurs when price makes a higher high but MACD makes a lower high.
MACD divergence can provide an early indication that momentum is weakening, but it does not guarantee a reversal. Traders can analyse divergence using either the MACD line or MACD histogram and then look to price action or market structure for additional confirmation.
What Is MACD Divergence?
MACD divergence is a disagreement between the direction of price and the direction of the MACD indicator.
In a strong directional move, price and momentum will often move broadly together. Higher price highs may be accompanied by higher MACD highs, while new price lows can occur alongside lower MACD readings.
Divergence appears when this relationship changes.
For example, price might make a new high while MACD produces a lower high. Price has continued upwards, but momentum measured by MACD has not confirmed the latest high.
The opposite can occur during a decline. Price reaches a new low while MACD forms a higher low, indicating that bearish momentum has weakened relative to the previous price low.
CME Group identifies divergence as one of the main signals traders analyse with oscillators and notes that MACD moving in a different direction from price can indicate a possible change in trend.
The important word is possible. Divergence measures changing momentum rather than predicting with certainty where price will move next.
How Does MACD Work?
MACD, or Moving Average Convergence Divergence, is a momentum indicator built from exponential moving averages.
The standard MACD calculation uses:
MACD line = 12-period EMA – 26-period EMA
A 9-period exponential moving average of the MACD line is then used to create the signal line.
Standard MACD therefore consists of:
MACD line: The difference between the shorter and longer EMA.
Signal line: A smoothed EMA of the MACD line.
MACD histogram: The difference between the MACD line and signal line.
When the shorter EMA moves further above the longer EMA, MACD rises. When the shorter EMA moves further below the longer EMA, MACD falls.
This means MACD divergence is ultimately showing that the relationship between short and longer-term momentum is changing even though price has continued moving in its existing direction.
MACD Histogram Explained
The MACD histogram visually represents the difference between the MACD line and the signal line, making it easier to see whether momentum between the two is expanding or contracting.
The calculation is:
MACD Histogram = MACD Line – Signal Line
If the MACD line is above the signal line, the histogram is positive and appears above zero.
If the MACD line is below the signal line, the histogram is negative and appears below zero.
Charles Schwab explains that MACD is commonly interpreted in relation to its signal line, with the distance between the two reflecting changes in momentum. The MACD histogram visualises that relationship by showing the difference between the MACD line and signal line.
The size and direction of the histogram bars are therefore important.
Growing positive bars show the MACD line moving further above the signal line.
Shrinking positive bars show the MACD and signal lines moving closer together.
Growing negative bars show the MACD line moving further below the signal line.
Shrinking negative bars show the MACD and signal lines converging.
A shrinking histogram can therefore show that momentum is changing before the MACD and signal lines actually cross.
However, a shrinking histogram is not automatically a reversal signal. The lines can begin separating again and the existing trend can continue.
What Is MACD Histogram Divergence?
MACD histogram divergence occurs when price makes a new high or low but the corresponding peak or trough in the MACD histogram moves in the opposite direction.
For example:
Price: higher high
MACD histogram: lower positive peak
This is bearish MACD histogram divergence.
Alternatively:
Price: lower low
MACD histogram: higher negative trough
This is bullish MACD histogram divergence.
Histogram divergence is slightly different from comparing price directly with the MACD line.
The MACD line represents the difference between two exponential moving averages. The histogram represents the difference between the MACD line and its signal line.
Histogram divergence therefore focuses specifically on changes in the momentum of MACD itself.
This can make the histogram particularly useful for visualising when momentum is contracting even though price is still moving in its original direction.
Quantifying Bullish MACD Histogram Divergence
Bullish MACD histogram divergence can be quantified by comparing two corresponding price lows with the MACD histogram values recorded around those lows.
The basic condition is:
Price Low 2 < Price Low 1
while:
MACD Histogram Low 2 > MACD Histogram Low 1
Price has therefore fallen further, but the MACD histogram has become less negative.
For example:
| Measurement | First low | Second low |
| Price | $100 | $95 |
| MACD histogram | -2.0 | -1.2 |
Price has declined by another 5%, producing a lower low.
The MACD histogram has moved from -2.0 to -1.2, creating a higher low.
This can be quantified in several ways.
Absolute histogram difference
The simplest measurement is:
Histogram divergence = Histogram Low 2 – Histogram Low 1
Using the example:
-1.2 – (-2.0) = +0.8
The histogram has improved by 0.8 units while price has made a lower low.
Percentage change in histogram magnitude
The contraction in negative histogram magnitude can also be expressed as a percentage:
(|First Histogram Low| – |Second Histogram Low|) / |First Histogram Low| × 100
Using the example:
(2.0 – 1.2) / 2.0 × 100 = 40%
The magnitude of the negative histogram has therefore contracted by 40%.
That provides a numerical description of the divergence, but it does not mean that a 40% contraction has a fixed probability of producing a reversal.
Price change alongside histogram change
A trader or analyst can also record both variables:
Price: -5%
Histogram magnitude: -40%
This shows that price has continued lower while bearish MACD histogram momentum has contracted substantially.
Quantifying the relationship can be useful when backtesting because it replaces a subjective observation such as “the second histogram trough looks higher” with predefined rules.
For example, a test could require:
- price to make a lower low
- the corresponding histogram trough to make a higher low
- a minimum percentage contraction in histogram magnitude
- both lows to occur within a defined number of periods
- subsequent price confirmation before recording an entry
The thresholds would need to be tested rather than assumed to improve performance.
Most importantly, the raw MACD histogram value cannot be treated as directly comparable across every instrument. MACD is based on price differences and does not have a fixed scale like RSI. A histogram movement of 1.0 can represent something very different on instruments trading at different price levels.
Any systematic attempt to compare divergence strength across different instruments may therefore require normalisation, such as expressing MACD values relative to price, before drawing conclusions.
What Is Bullish MACD Divergence?
Bullish MACD divergence occurs when price makes a lower low while MACD makes a higher low.
The structure is:
Price: lower low
MACD: higher low
Potential interpretation: weakening bearish momentum
Imagine price falls from $105 to $100, recovers, and then declines again to $95.
Price has made a lower low.
During the first decline, MACD reaches -3.0. During the second decline, MACD only reaches -2.0.
MACD has therefore formed a higher low while price has formed a lower low.
The second decline has pushed price further down, but the difference between shorter and longer-term momentum has not become as negative as it was during the first decline.
This is bullish divergence.
It can warn that bearish momentum is weakening, but sellers can remain in control even after divergence appears.
What Is Bearish MACD Divergence?
Bearish MACD divergence occurs when price makes a higher high while MACD forms a lower high.
The structure is:
Price: higher high
MACD: lower high
Potential interpretation: weakening bullish momentum
For example, price might rise to $100, pull back and then rally to $105.
During the first rally, MACD reaches 3.0. During the second rally, MACD only reaches 2.2.
Price has made a higher high while MACD has made a lower high.
The latest rally has therefore taken price further upwards without producing the same level of momentum measured by MACD.
This can indicate that bullish momentum is weakening.
However, weakening momentum does not automatically mean sellers have taken control. Price can continue making higher highs despite MACD divergence.
MACD Line Divergence vs MACD Histogram Divergence
MACD line divergence and MACD histogram divergence both compare price with momentum, but they measure different relationships.
MACD line divergence compares price with the difference between the shorter and longer EMAs.
MACD histogram divergence compares price with the difference between the MACD line and its signal line.
This distinction matters.
The histogram can begin contracting while the MACD line is still rising.
For example, MACD could move:
2.0 → 2.5 → 2.8
while its signal line moves:
1.5 → 2.1 → 2.7
MACD itself is still increasing, but the difference has changed:
0.5 → 0.4 → 0.1
The histogram is shrinking because the signal line is catching up with MACD.
Histogram divergence can therefore highlight changes in momentum that are not as visually obvious from the MACD line alone.
Neither should automatically be considered superior. They describe different relationships within the same indicator.
What Is Hidden MACD Divergence?
Hidden MACD divergence is generally interpreted as a possible continuation signal rather than a reversal signal.
There are two main forms.
Hidden bullish MACD divergence
Hidden bullish divergence occurs when:
Price: higher low
MACD: lower low
Price has maintained the higher-low structure associated with an uptrend despite MACD producing a deeper momentum low.
The interpretation is that the pullback may have generated substantial short-term negative momentum without breaking the broader bullish price structure.
Hidden bearish MACD divergence
Hidden bearish divergence occurs when:
Price: lower high
MACD: higher high
Price has maintained the lower-high structure associated with a downtrend despite MACD producing a stronger positive momentum reading.
Hidden divergence is highly dependent on trend context.
Understanding whether price is actually producing higher highs, higher lows, lower highs or lower lows through market structure is therefore particularly important before interpreting hidden divergence.
Regular vs Hidden MACD Divergence
Regular and hidden divergence are used to identify different potential market conditions.
| Type | Price | MACD | Common interpretation |
| Regular bullish | Lower low | Higher low | Possible bullish reversal |
| Regular bearish | Higher high | Lower high | Possible bearish reversal |
| Hidden bullish | Higher low | Lower low | Possible bullish continuation |
| Hidden bearish | Lower high | Higher high | Possible bearish continuation |
Regular divergence suggests that momentum may no longer support the existing price direction.
Hidden divergence suggests that the existing trend may remain intact despite a momentum move during a pullback.
Neither guarantees the expected outcome.
How to Identify MACD Divergence
MACD divergence can be identified by comparing equivalent swing points in price and the MACD indicator.
A basic process is:
- Add MACD to the price chart.
- Identify two clear swing highs or two clear swing lows.
- Locate the corresponding points on MACD.
- Compare the direction of the price swings with the MACD swings.
- Determine whether the divergence is regular or hidden.
- Check whether the MACD line or histogram is being analysed.
- Look for additional confirmation from price.
For regular bullish divergence, price should form a lower low while MACD forms a higher low.
For regular bearish divergence, price should form a higher high while MACD forms a lower high.
The swing points should correspond to approximately the same periods. Selecting unrelated peaks and troughs simply because they create opposing slopes can produce misleading divergence signals.
How Do You Confirm MACD Divergence?
MACD divergence itself is evidence of changing momentum, not confirmation that price has reversed.
Price can provide additional evidence.
Suppose a market is in a downtrend and forms bullish MACD divergence.
The sequence might be:
1. Price makes a lower low.
2. MACD makes a higher low.
3. Price begins recovering.
4. A previous lower high is broken.
The fourth event is materially different from the first two because price structure itself has now changed.
The distinction between a market structure shift and break of structure can therefore help traders assess whether momentum divergence is developing into a broader change in price behaviour.
Other forms of confirmation can include support and resistance, candlestick behaviour, trendlines or volume.
Confirmation does not make a trade certain. It simply means the analysis is no longer based on divergence alone.
MACD Divergence vs MACD Crossover
MACD divergence and MACD crossovers are different signals.
Divergence compares the direction of price with the direction of MACD.
A crossover compares the MACD line with its signal line.
A bullish MACD crossover occurs when the MACD line moves above the signal line.
A bearish crossover occurs when MACD moves below its signal line.
Divergence can develop before a crossover because momentum may begin weakening while the MACD and signal lines remain in their existing positions.
Fidelity notes that divergence between MACD and price can become a stronger signal when it confirms crossover signals.
This provides one possible sequence:
Divergence → momentum changes → MACD crossover → price confirmation
The sequence will not occur cleanly on every chart, and waiting for more confirmation generally means entering later if a reversal does occur.
Does MACD Divergence Predict a Reversal?
No. MACD divergence does not reliably predict that a market must reverse.
It identifies a change in the relationship between price and momentum.
A strong trend can continue after divergence develops because momentum does not need to keep accelerating for price to continue moving in the same direction.
Consider an established uptrend.
Price may continue making higher highs while each successive rally has slightly less momentum than the previous one. Bearish divergence could therefore persist across several price highs before a reversal eventually occurs, or the divergence may disappear as momentum strengthens again.
This is one of the biggest risks of using divergence as a standalone entry signal.
A trader who immediately sells every bearish divergence may repeatedly position against an otherwise intact bullish trend.
Can MACD Divergence Give False Signals?
Yes. MACD divergence can appear without the expected reversal or continuation occurring.
Common causes of misleading divergence include:
Strong trends
Momentum can weaken while price continues trending.
Poor swing selection
Connecting unrelated MACD and price points can create divergence that has little analytical significance.
Entering before the swing is complete
A MACD peak or trough can continue developing after a trader initially identifies divergence.
Short timeframes
Shorter charts can contain more market noise, creating frequent changes in momentum that have little relevance to the broader trend.
Range-bound markets
MACD can generate repeated changes around its signal and zero lines when price lacks a sustained direction.
Fidelity specifically notes that MACD can whipsaw during trading ranges as the fast line repeatedly crosses the signal line.
Divergence should therefore be assessed in the context of the broader market rather than treated as an isolated signal.
What Are the Best MACD Settings for Divergence?
The standard MACD settings are 12, 26 and 9.
These represent:
12: shorter EMA
26: longer EMA
9: EMA used for the signal line
These settings are widely used as a starting point for MACD analysis.
Changing them changes the sensitivity of the indicator.
Shorter periods generally make MACD respond more quickly to recent price changes, which can create more peaks, troughs and potential divergence signals.
Longer periods produce a smoother indicator but respond more slowly.
There is no universal MACD configuration that produces the most accurate divergence signals across every market and timeframe.
Any alternative settings should ideally be tested consistently rather than selected because they make a small number of historical examples look better.
Which Timeframe Is Best for MACD Divergence?
MACD divergence can appear on any timeframe because the indicator uses the price periods shown on the chart.
A divergence can therefore develop on a one-minute, one-hour, four-hour, daily or weekly chart.
The significance of the divergence remains tied to that timeframe.
A bearish divergence on a five-minute chart indicates a short-term change in momentum. It does not automatically override a strong bullish trend visible on a daily chart.
Likewise, divergence developing across major daily swing points represents a much longer period of changing momentum.
For traders using swing trading strategies, daily or multi-hour divergence may therefore provide different information from the same pattern appearing on a very short-term chart.
There is no single timeframe that guarantees more reliable divergence.
MACD Divergence vs RSI Divergence
MACD and RSI can both identify divergence, but they measure momentum differently.
MACD measures the relationship between shorter and longer exponential moving averages.
RSI compares the magnitude of recent upward price changes with recent downward price changes.
A market can therefore show divergence on one indicator without showing exactly the same pattern on the other.
RSI also has a fixed scale between 0 and 100, while MACD has no fixed upper and lower boundaries.
Neither type of divergence is inherently superior.
Using both can provide two different views of momentum, but because both indicators ultimately use historical price data, agreement between them does not guarantee that price will reverse.
How Can MACD Divergence Be Used in a Trading Strategy?
MACD divergence can form one component of a rules-based trading process.
A reversal framework might involve:
1. Establish the existing trend
Determine whether price is trending upwards, downwards or moving sideways.
2. Identify divergence
Compare equivalent price and MACD swing points.
3. Classify the divergence
Determine whether it is regular bullish, regular bearish or hidden divergence.
4. Check the histogram
Assess whether histogram momentum is expanding or contracting.
5. Wait for price confirmation
Look for evidence that price structure is beginning to change.
6. Define invalidation
Establish the price level that would show the original trade idea is wrong.
7. Determine position size
Size the position based on the predefined risk and distance to the invalidation point.
This creates a repeatable process that can be tested rather than assuming every MACD divergence should result in a trade.
What Are the Limitations of MACD Divergence?
MACD divergence can provide useful information about momentum, but it has several important limitations.
It is based on historical prices. MACD cannot know where the market will move next.
Divergence can persist. Price can continue trending while MACD produces increasingly weaker momentum readings.
Swing selection can be subjective. Different traders can identify different peaks and troughs.
MACD has no fixed scale. Raw divergence values are difficult to compare directly between instruments with different price characteristics.
More sensitivity creates more signals. Faster settings can reveal smaller momentum changes but can also increase noise.
Confirmation introduces delay. Waiting for price or MACD crossover confirmation can reduce false entries but means entering later when the expected move occurs.
These limitations are why divergence is generally more useful as evidence within a broader trading process than as a standalone prediction.
Using MACD Divergence With LQH Markets
MACD is available within MetaTrader 5 and can be added to different chart timeframes to compare price swings with changes in momentum.
LQH Markets provides access to MT5 for trading across forex, indices, commodities, stocks and cryptocurrencies. Traders can use the MACD line, signal line and histogram alongside price charts and market structure when analysing potential divergence.
Traders who want to practise identifying bullish, bearish and histogram divergence can start with an LQH Markets demo account, allowing different MACD settings, markets and timeframes to be tested without risking real capital.
Ready to get started? Open a live LQH Markets account or start with a demo account.
Risk disclaimer
CFDs are complex instruments with a high risk of losing all your invested capital. Only trade with money you can afford to lose. Content is for general information only and is not investment advice.
MACD Divergence FAQs
MACD divergence occurs when price and the MACD indicator move in different directions. Bullish divergence occurs when price makes a lower low while MACD makes a higher low, while bearish divergence occurs when price makes a higher high while MACD makes a lower high. It indicates changing momentum but does not guarantee a price reversal.
MACD histogram divergence can identify changes in momentum, but it is not a guaranteed reversal signal. The histogram can begin contracting while price continues trending in the same direction. Traders may therefore combine histogram divergence with price structure, crossovers or other confirmation rather than using it alone.
Bullish MACD histogram divergence occurs when price makes a lower low while the MACD histogram makes a higher low. This means price has continued falling while the negative difference between MACD and its signal line has become smaller, indicating that bearish momentum may be weakening.
Neither MACD nor RSI divergence is universally better. MACD divergence reflects changes in the relationship between shorter and longer exponential moving averages, while RSI divergence reflects changes in the relative strength of recent gains and losses. They measure momentum differently and can therefore produce different signals.
MACD divergence compares the direction of MACD with the direction of price, while a MACD crossover occurs when the MACD line crosses its signal line. Divergence can develop before a crossover and indicate that momentum is changing, while the crossover provides a separate signal that the relationship between the MACD and signal lines has changed.