RSI and MACD are both momentum indicators, but they measure price momentum differently. RSI compares the strength of recent gains with recent losses on a scale from 0 to 100, while MACD compares shorter and longer exponential moving averages to show changes in momentum and trend direction.
Neither RSI nor MACD is universally better. RSI is particularly useful for analysing momentum, overbought and oversold conditions and divergence, while MACD can help traders assess trend momentum through signal-line crossovers, zero-line movements and divergence.
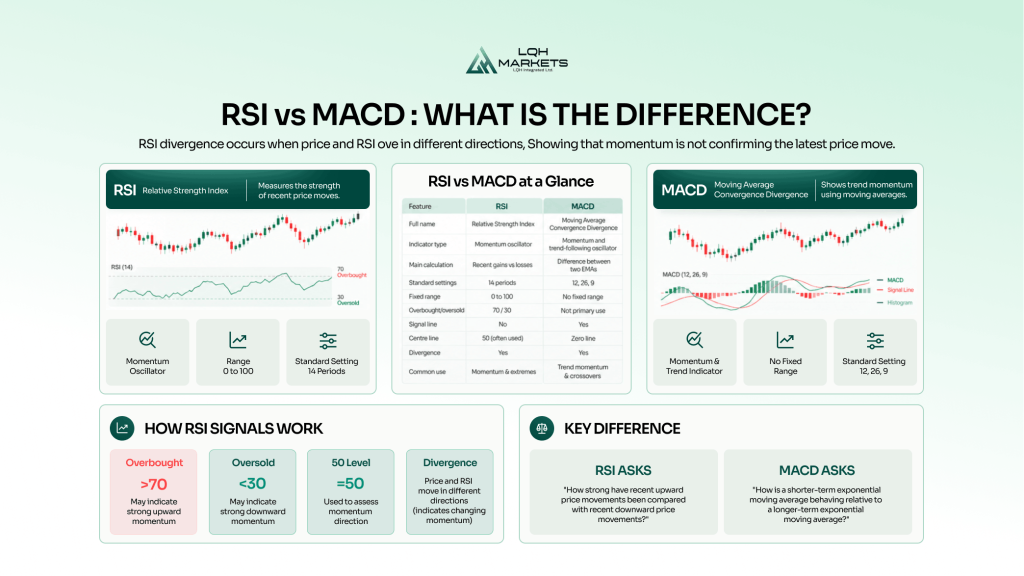
RSI vs MACD at a Glance
RSI and MACD use the same underlying price data but transform it in very different ways.
| Feature | RSI | MACD |
| Full name | Relative Strength Index | Moving Average Convergence Divergence |
| Indicator type | Momentum oscillator | Momentum and trend-following oscillator |
| Main calculation | Recent gains vs recent losses | Difference between two EMAs |
| Standard settings | 14 periods | 12, 26, 9 |
| Fixed range | 0 to 100 | No fixed upper/lower range |
| Overbought/oversold | Commonly 70/30 | Not traditionally its primary use |
| Signal line | No | Yes |
| Zero/centre line | 50 often used for momentum context | Zero line |
| Divergence | Yes | Yes |
| Common use | Momentum and extremes | Trend momentum and crossovers |
The key difference is therefore not simply that RSI is “faster” and MACD is “slower”. The indicators are calculating different relationships within historical price data.
What Is RSI?
The Relative Strength Index, or RSI, is a momentum oscillator developed by J. Welles Wilder that measures the magnitude of recent upward and downward price changes.
RSI moves between 0 and 100.
The standard setting is 14 periods, although traders can adjust the lookback depending on the market and strategy.
The simplified RSI formula is:
RSI = 100 – [100 / (1 + RS)]
Where RS represents average gains divided by average losses over the selected period.
RSI readings above 70 are traditionally described as overbought, while readings below 30 are considered oversold.
However, these levels should not automatically be interpreted as instructions to sell or buy.
Fidelity’s RSI guidance notes that RSI can remain overbought or oversold for extended periods during strong trends. RSI can also be analysed through divergence, failure swings and broader changes in momentum.
What Is MACD?
Moving Average Convergence Divergence, or MACD, is a momentum oscillator built from exponential moving averages.
The standard MACD calculation uses:
MACD line = 12-period EMA – 26-period EMA
A 9-period EMA of the MACD line then creates the signal line.
Many charting platforms also display a MACD histogram, which represents the difference between the MACD line and signal line.
MACD therefore normally has three visible components:
MACD line: Shows the relationship between the shorter and longer EMA.
Signal line: A smoothed average of the MACD line.
Histogram: Shows the distance between the MACD and signal lines.
Fidelity describes MACD as a momentum oscillator primarily used to trade trends. Unlike RSI, MACD is not typically used to identify overbought and oversold conditions because it does not oscillate within fixed upper and lower boundaries.
What Is the Main Difference Between RSI and MACD?
The main difference between RSI and MACD is what each indicator measures.
RSI asks:
How strong have recent upward price movements been compared with recent downward price movements?
MACD asks:
How is a shorter-term exponential moving average behaving relative to a longer-term exponential moving average?
CME Group’s technical analysis material describes RSI as comparing the average size of upward moves with the average size of downward moves. MACD instead subtracts a longer moving average from a shorter moving average.
This distinction explains why the two indicators can give different signals on exactly the same chart.
RSI may show strong momentum without MACD producing a crossover. Likewise, MACD may show that short-term momentum is strengthening relative to the longer-term trend without RSI reaching an extreme level.
Neither signal contradicts the other. They are describing different characteristics of recent price behaviour.
How Do RSI Signals Work?
RSI can produce several types of technical signals.
Overbought and oversold levels
The best-known RSI levels are:
Above 70: traditionally considered overbought.
Below 30: traditionally considered oversold.
These readings show that recent price movement has been unusually strong in one direction according to RSI’s calculation. They do not establish that price has moved “too far” in an economic or fundamental sense.
The RSI 50 level
The midpoint of the RSI scale can also provide information about momentum.
RSI spending more time above 50 can be associated with stronger positive momentum, while readings predominantly below 50 can accompany negative momentum.
RSI divergence
Divergence occurs when RSI and price stop moving in the same direction.
For example, price could make a higher high while RSI forms a lower high. This bearish RSI divergence indicates that momentum has not confirmed the latest price high.
Conversely, price making a lower low while RSI forms a higher low creates bullish RSI divergence.
Divergence indicates changing momentum rather than guaranteeing a reversal.
How Do MACD Signals Work?
MACD is commonly interpreted through signal-line crossovers, the zero line, the histogram and divergence.
MACD signal-line crossover
A bullish crossover occurs when the MACD line crosses above the signal line.
A bearish crossover occurs when the MACD line crosses below it.
These crossovers indicate that the relationship between shorter and longer-term momentum is changing. They do not guarantee that price will continue in the direction of the crossover.
MACD zero-line crossover
The MACD zero line represents the point where the shorter and longer EMAs have the same value.
When MACD moves above zero, the shorter EMA has moved above the longer EMA.
When MACD moves below zero, the shorter EMA is below the longer EMA.
The zero line can therefore provide broader context about the relationship between shorter and longer-term price trends.
MACD histogram
The histogram represents the difference between the MACD line and signal line.
Growing bars show the two lines moving further apart, while shrinking bars indicate that they are converging.
This allows traders to visualise changes in momentum before or around a crossover.
MACD divergence
Like RSI, MACD can diverge from price.
If price makes a higher high while MACD makes a lower high, upward momentum may be weakening. If price forms a lower low while MACD forms a higher low, downward momentum may be weakening.
Fidelity notes that MACD divergence can become more meaningful when it confirms crossover signals rather than being considered in isolation.
RSI vs MACD: Overbought and Oversold Conditions
RSI is much more naturally suited to identifying traditional overbought and oversold conditions than MACD.
RSI has a fixed scale:
70: commonly used overbought threshold
30: commonly used oversold threshold
MACD has no equivalent fixed upper and lower boundaries.
This is an important distinction because MACD values also depend on the price characteristics of the instrument being analysed. A MACD value that appears unusually high for one market may be completely normal for another.
Fidelity therefore describes MACD as an oscillator primarily used for trading trends rather than identifying overbought and oversold conditions.
RSI is generally the more intuitive choice when the specific question is whether recent momentum has reached an extreme relative to its own calculation.
Even then, an extreme RSI reading does not mean a reversal is inevitable.
RSI Divergence vs MACD Divergence
Both RSI and MACD can be used to identify divergence, but the underlying momentum measurement is different.
RSI divergence compares price swings with changes in the relative strength of recent gains and losses.
MACD divergence compares price swings with changes in the relationship between shorter and longer exponential moving averages.
For example, imagine price makes a new higher high.
If RSI forms a lower high, RSI momentum has failed to confirm the new price extreme.
If MACD also forms a lower high, the relationship between short and longer-term momentum has weakened as price continued higher.
Either can provide useful information, but neither proves that the market is about to reverse.
Traders may therefore combine divergence with market structure to see whether price itself begins confirming the change in momentum.
For example, bearish divergence followed by price breaking an important higher low provides different information from bearish divergence while price continues producing higher highs and higher lows.
Which Is Faster, RSI or MACD?
RSI will often respond more directly to recent price changes, while MACD incorporates exponential moving averages that smooth price data.
However, simply describing RSI as “fast” and MACD as “slow” can be misleading.
Their responsiveness depends partly on their settings.
A shorter RSI period will react more strongly to recent movements. Changing the periods used for MACD can similarly make it more or less responsive.
More importantly, the two indicators measure different relationships.
RSI responds to the balance between recent gains and losses, while MACD responds to convergence and divergence between moving averages.
A faster response is not automatically an advantage. More sensitive settings can create more signals, but those signals can also reflect short-term market noise.
Is RSI or MACD Better for Trending Markets?
MACD can be particularly useful for assessing trend momentum because its calculation directly compares shorter and longer exponential moving averages.
If the shorter EMA is increasingly above the longer EMA, MACD reflects that growing separation. Signal-line and zero-line crossovers can then help identify changes in that relationship.
However, MACD can become less useful in choppy or range-bound conditions.
Fidelity notes that MACD can whipsaw during trading ranges, with the faster line repeatedly crossing backwards and forwards across the signal line.
RSI can also provide useful information within trends, but traders should be cautious about treating overbought or oversold readings as automatic reversal signals.
A strong bullish trend can keep RSI above 70 for an extended period. Likewise, sustained bearish momentum can keep RSI below 30.
Establishing the market structure first can therefore help put either indicator into context.
Is RSI or MACD Better for Sideways Markets?
RSI can be particularly intuitive when price is moving within a range because its bounded 0 to 100 scale makes changes between stronger and weaker momentum easy to identify.
For example, if a market repeatedly moves between established support and resistance, RSI may approach its traditional oversold zone near the bottom of the range and its overbought zone near the top.
That does not mean those levels will continue to hold.
MACD can struggle when there is little sustained directional trend. The MACD and signal lines may repeatedly cross as short-term price movement changes direction, producing whipsaws.
Neither indicator can determine in advance whether a range will continue or break.
This makes price context important even when an oscillator appears to produce a clear signal.
Can RSI and MACD Be Used Together?
Yes. RSI and MACD can be used together because they calculate momentum differently, but agreement between them should not be treated as guaranteed confirmation.
A trader might use:
MACD for trend momentum: Is shorter-term momentum strengthening or weakening relative to the longer-term trend?
RSI for momentum conditions: How strong have recent gains been compared with losses, and is RSI approaching an extreme?
For example, imagine a market is in an established uptrend.
MACD remains above zero, indicating that the shorter EMA remains above the longer EMA. Price then pulls back and RSI falls from an elevated level towards 40.
If RSI subsequently turns upwards while MACD produces a bullish crossover, the indicators are providing two different perspectives on improving momentum.
However, both are still calculated from historical price data.
Using two indicators does not create certainty.
Price behaviour itself can provide an additional source of information. A trader might therefore combine RSI or MACD with swing highs, swing lows and a market structure shift or break of structure rather than relying exclusively on indicator agreement.
RSI and MACD Trading Strategy Example
RSI and MACD can be combined within a rules-based strategy, but neither needs to act as an automatic entry trigger.
One possible framework is:
1. Establish market direction
Identify whether price is trending upwards, trending downwards or ranging.
2. Analyse MACD
Check whether MACD is above or below zero and whether the MACD and signal lines are converging or diverging.
3. Analyse RSI
Assess whether RSI supports the prevailing momentum or shows signs of divergence or an extreme reading.
4. Wait for price confirmation
Look for price itself to confirm the setup through a swing break, rejection or change in structure.
5. Define invalidation
Determine where the original trade idea would no longer be valid.
6. Size the position
Position size should reflect the distance to the invalidation point and the amount of capital being risked.
This framework uses RSI and MACD as analytical tools rather than assuming every crossover or overbought reading should result in a trade.
What Are the Best RSI and MACD Settings?
The standard starting settings are RSI 14 and MACD 12, 26, 9.
For RSI:
14: lookback period
70: traditional overbought threshold
30: traditional oversold threshold
For MACD:
12: shorter EMA
26: longer EMA
9: signal-line EMA
Both CME Group and Fidelity describe 12, 26 and 9 as the commonly used MACD configuration.
These defaults are starting points rather than universally optimal settings.
Reducing the periods generally makes an indicator more sensitive to recent price changes. Increasing them generally produces smoother readings.
Changing settings specifically to make historical trades look better can also lead to overfitting. Any alternative configuration should therefore be tested consistently across enough historical and unseen market data to determine how it behaves.
RSI vs MACD for Short-Term Trading
Both RSI and MACD can be applied to intraday charts.
RSI’s sensitivity to recent gains and losses can help traders monitor short-term momentum, while MACD can help identify whether shorter-term price momentum is strengthening or weakening relative to a longer moving average.
On very short timeframes, however, both indicators are exposed to greater amounts of short-term price noise.
A MACD crossover on a five-minute chart does not have the same timeframe significance as a crossover on a daily chart. Likewise, an oversold RSI reading on a short-term chart can occur while the higher-timeframe market remains strongly bearish.
Timeframe should therefore form part of the interpretation rather than being treated simply as a way to generate more signals.
RSI vs MACD for Swing Trading
RSI and MACD can both be used when analysing trades held across multiple trading sessions.
MACD can provide a relatively smooth view of trend momentum, while RSI can show how the balance between recent gains and losses changes during individual swings.
For example, a trader analysing a daily uptrend could use MACD to monitor broader momentum while watching RSI during pullbacks.
However, the holding period alone does not make either indicator more accurate.
A swing trading strategy still needs clear entry, exit, position sizing and risk rules regardless of the technical indicator being used.
What Are the Limitations of RSI and MACD?
RSI and MACD are calculated entirely from historical price data, so neither can know what will happen next.
RSI limitations
RSI can remain overbought or oversold during strong trends, produce divergence long before price reverses and generate additional signals when shorter settings make it more sensitive.
MACD limitations
MACD is derived from moving averages and therefore reacts to price movements that have already occurred. It can also produce repeated crossovers in sideways markets where there is no sustained trend.
Limitations shared by both
Both indicators can:
- produce false or temporary signals
- give different signals across different timeframes
- diverge from price without a subsequent reversal
- become less useful when interpreted without market context
- encourage overtrading when every indicator movement is treated as an entry signal
CME Group notes that oscillators can remain overbought or oversold while the original price trend continues and recommends using oscillator information alongside other analysis.
RSI or MACD: Which Is Better?
Neither RSI nor MACD is universally better. RSI is generally more suitable for measuring the strength of recent gains against losses and identifying momentum extremes, while MACD is generally more suitable for assessing changes in trend momentum through moving-average relationships.
The choice can be simplified by asking what information is needed:
Use RSI when asking:
How strong are recent gains compared with recent losses?
Use MACD when asking:
How is shorter-term momentum changing relative to the longer-term trend?
Consider both when asking:
Does momentum from two differently calculated indicators support the same interpretation of price?
The final question should still be what price itself is doing.
A technically overbought RSI does not automatically end an uptrend, and a bearish MACD crossover does not guarantee that price will fall. Indicators are most useful when they provide context within a defined trading process rather than being treated as predictions.
Using RSI and MACD With LQH Markets
RSI and MACD are available as technical indicators within MetaTrader 5 and can be applied across different chart timeframes.
LQH Markets provides access to MT5 for trading across forex, indices, commodities, stocks and cryptocurrencies. Traders can use RSI and MACD alongside price charts and market structure to analyse momentum across these markets.
A demo environment can also be used to compare how RSI and MACD behave in trending, ranging and volatile conditions before incorporating either indicator into a live trading strategy.
Ready to get started? Open a live LQH Markets account or start with a demo account.
Risk disclaimer
CFDs are complex instruments with a high risk of losing all your invested capital. Only trade with money you can afford to lose. Content is for general information only and is not investment advice.
RSI vs MACD FAQs
MACD is not inherently better than RSI. MACD compares shorter and longer exponential moving averages and is commonly used to analyse trend momentum, while RSI compares recent gains and losses and is commonly used to assess momentum, overbought and oversold conditions and divergence. The more suitable indicator depends on the information a trader needs.
Neither RSI nor MACD is universally more accurate. Both are calculated from historical price data and can produce false signals. Their usefulness depends on the market environment, timeframe, settings and trading rules used to interpret their signals.
Yes. RSI and MACD can be used together because they calculate momentum differently. MACD can provide information about the relationship between shorter and longer-term momentum, while RSI measures the strength of recent gains against losses. However, agreement between the two does not guarantee a successful trade.
When RSI and MACD disagree, they are showing different characteristics of recent price behaviour. For example, RSI may reach an overbought level while MACD still shows strengthening trend momentum. This is not necessarily a contradiction because the indicators use different calculations. Traders can use price action and market structure to provide additional context.
The standard RSI setting is commonly 14 periods, with 70 and 30 used as traditional overbought and oversold thresholds. Standard MACD settings are commonly 12, 26 and 9, representing the shorter EMA, longer EMA and signal-line EMA respectively. These are defaults rather than guaranteed optimal settings for every market.