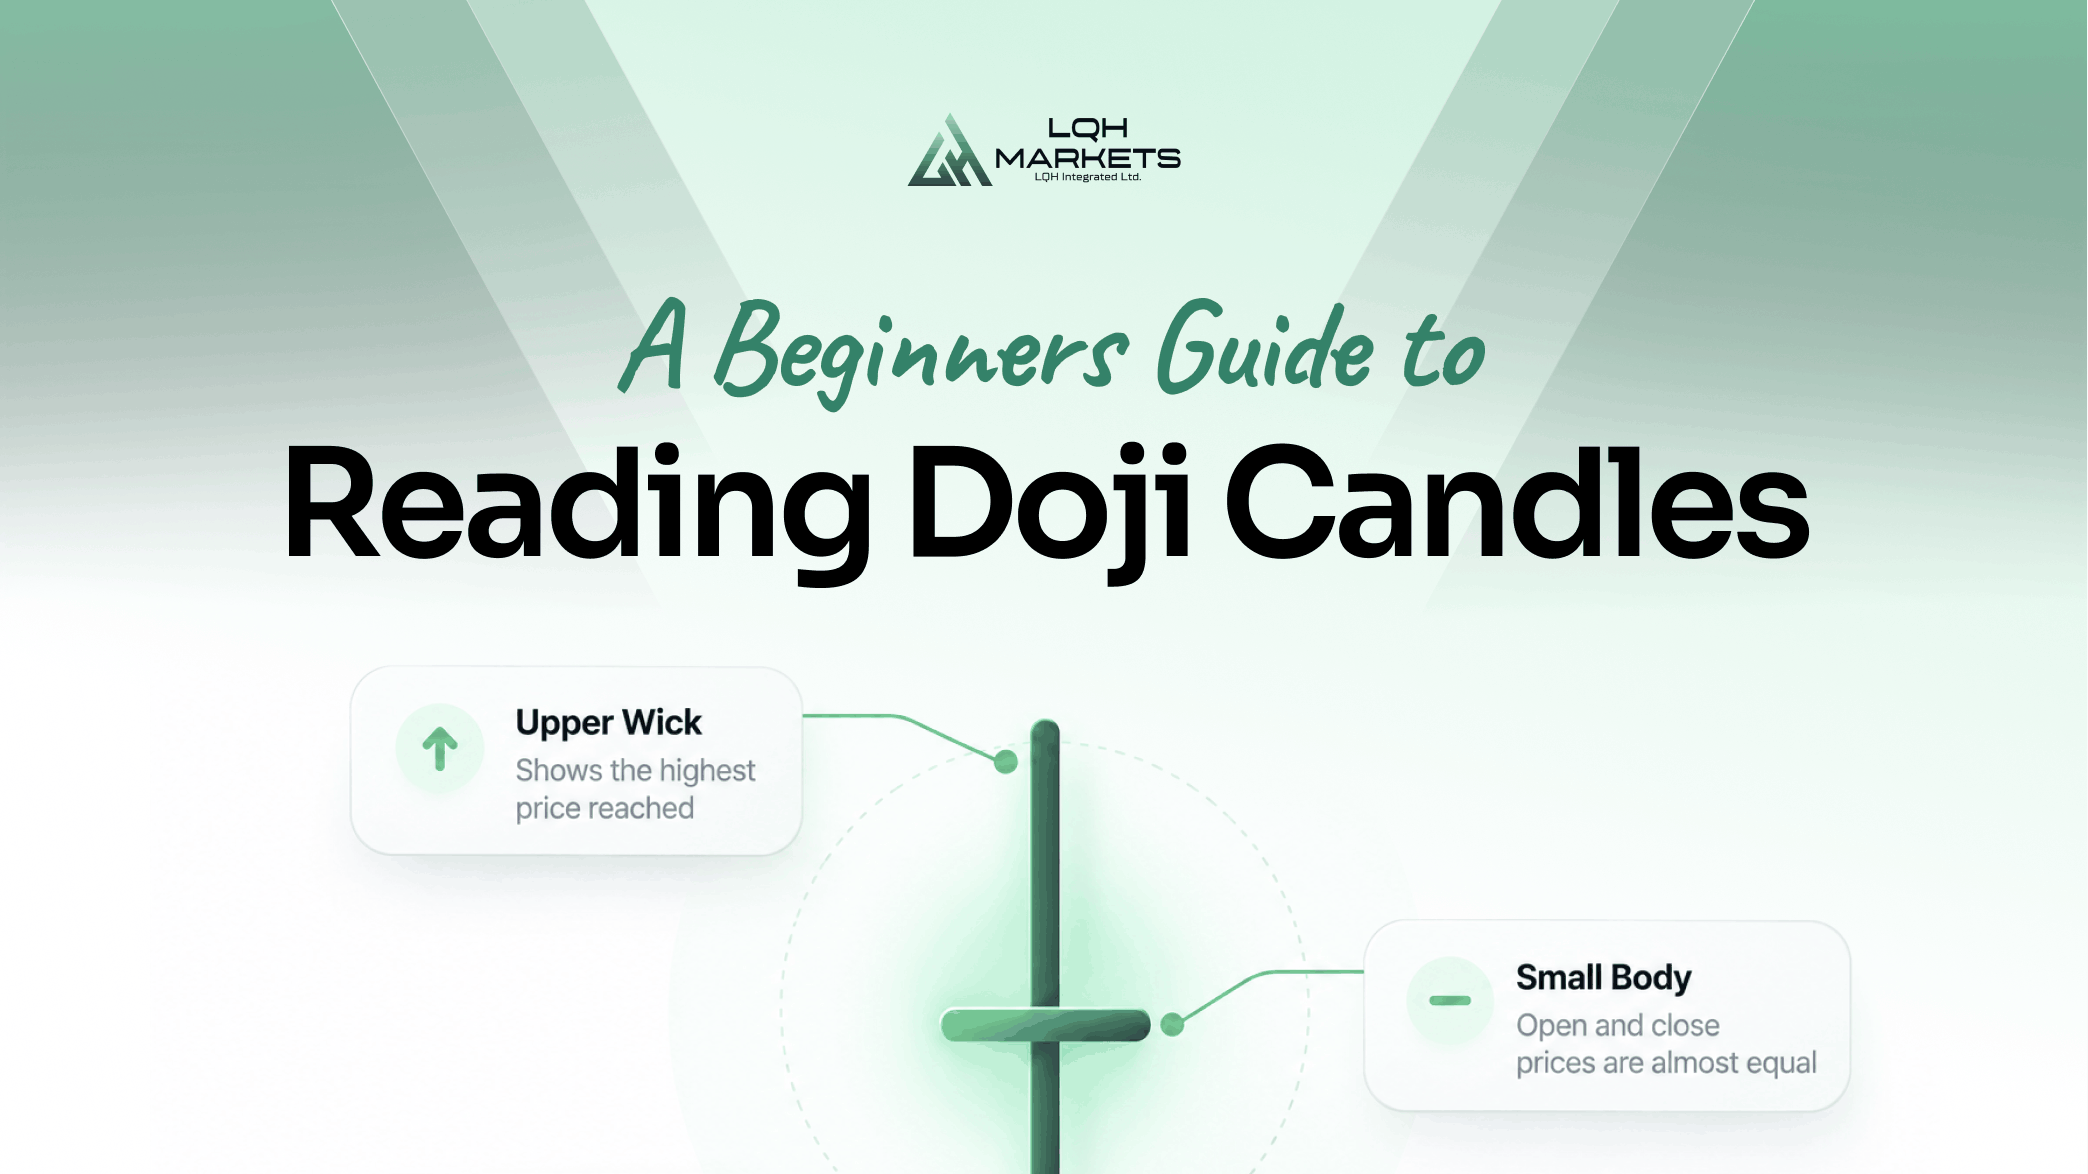
A doji candlestick is one of the easiest patterns to spot on a trading chart. With little or no visible body and wicks extending above, below or on both sides, a doji can look more like a cross than a conventional candlestick.
But recognising a doji is only the beginning.
A doji tells traders that the opening and closing prices for a particular period were the same, or very close. In other words, price moved during the period but eventually returned to roughly where it started.
This is commonly interpreted as market indecision. Buyers were unable to maintain control above the opening price, while sellers were unable to maintain control below it.
That does not automatically make a doji bullish or bearish.
Where the doji appears, what price was doing beforehand, the length of its wicks and what happens afterwards are all important when interpreting the pattern.
In this beginner’s guide, we’ll explain what a doji candlestick is, how to identify one, the different types of doji and how traders use them as part of technical analysis.
What Is a Doji Candlestick?
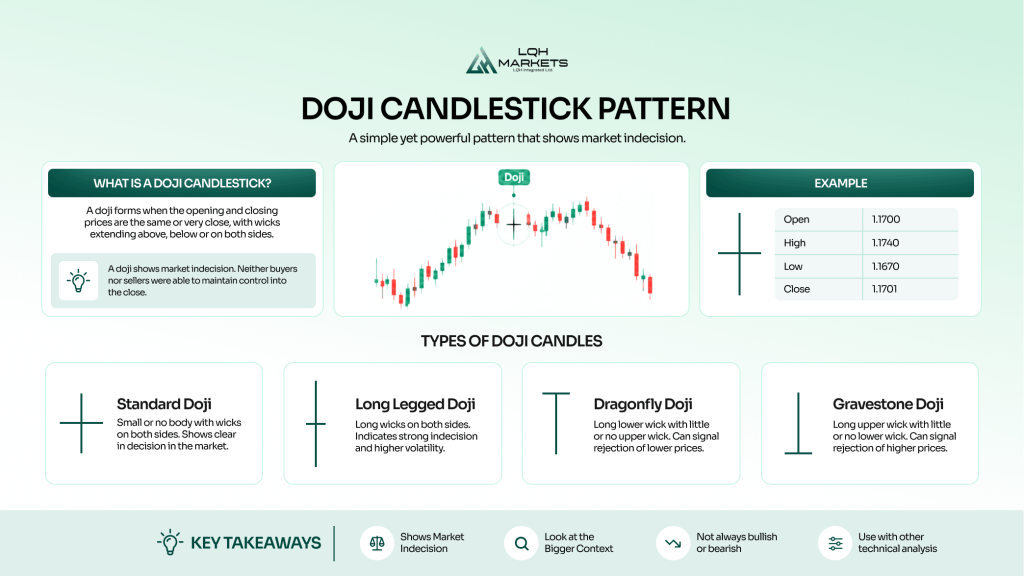
A doji candlestick is a candlestick pattern that forms when the opening and closing prices of an asset are identical or extremely close together.
Every candlestick contains four pieces of price information:
- Open: the price at the beginning of the period
- High: the highest price reached
- Low: the lowest price reached
- Close: the price at the end of the period
On a normal bullish or bearish candle, there is a visible body between the opening and closing prices.
With a doji, that body becomes extremely small or disappears completely because the opening and closing prices are almost identical.
For example, imagine EUR/USD opens a one-hour period at 1.1700.
During the hour it rises to 1.1740 before falling as low as 1.1670. By the end of the hour, however, EUR/USD has returned to 1.1701.
| Price | EUR/USD |
| Open | 1.1700 |
| High | 1.1740 |
| Low | 1.1670 |
| Close | 1.1701 |
Despite moving 70 pips between its high and low, the market has closed only one pip above where it started.
The resulting candle would have an extremely small body and wicks showing the movement above and below the opening price.
That is the basic idea behind a doji: price moved, but neither buyers nor sellers were able to maintain control into the close.
What Does a Doji Candle Mean?
A doji primarily represents a balance, or temporary stalemate, between buying and selling pressure.
Suppose a market has been rising consistently.
Buyers have been prepared to keep paying higher prices, creating a sequence of higher highs and higher lows. You can learn more about identifying these trends in our beginner’s guide to market structure.
A doji then forms.
Price may have continued higher during the candle, but by the close those gains have disappeared.
That can raise an important question:
Are buyers beginning to lose momentum?
The opposite can happen during a downtrend. Sellers push the market lower but cannot maintain the move, and price eventually closes close to where it opened.
However, a doji does not answer what happens next.
It tells you something about the period that has just finished: neither side established lasting control.
The next move could be a reversal, continuation or further consolidation.
This distinction is particularly important for beginners. A doji is better understood as a signal to pay closer attention to price action, rather than an automatic instruction to buy or sell.
How to Identify a Doji Candlestick
The easiest characteristic to identify is the candle’s body.
Look for a candle where:
- The opening and closing prices are identical or very close.
- The real body is therefore extremely small.
- One or more wicks may extend away from the body.
A perfect doji would have exactly the same opening and closing price.
Real markets are not always that precise.
Different instruments also trade at very different prices and increments, so traders generally focus on whether the difference between open and close is very small relative to the candle’s overall trading range rather than requiring exact equality.
This also prevents a common beginner mistake: confusing every small-bodied candle with a doji.
A candle can have a relatively small body without being a doji. Small-bodied candles are sometimes described as spinning tops when they retain a noticeable difference between their opening and closing prices.
The Five Main Types of Doji Candlestick
Not every doji looks the same.
The position of the open and close within the candle’s total range changes its appearance and can provide additional information about what happened between buyers and sellers.
1. Standard Doji
A standard doji has a tiny or non-existent body with upper and lower wicks.
It often resembles a plus sign.
The market moved both above and below its opening price but eventually closed near the same level.
This represents the classic form of indecision associated with a doji.
2. Long-Legged Doji
A long-legged doji has particularly long upper and lower wicks.
This tells a more dramatic story.
Both buyers and sellers managed to move price significantly during the period, but neither could retain control.
Imagine a market opening at $100, rallying to $110, falling to $91 and eventually closing at $100.
The close looks uneventful. The journey to that close was anything but.
Long-legged doji can therefore indicate significant intraperiod volatility despite very little net change between the open and close.
3. Dragonfly Doji
A dragonfly doji has a long lower wick and little or no upper wick.
The open and close occur near the highest price of the period.
This means sellers initially pushed price lower, but buyers subsequently recovered most or all of the decline.
Because of this, traders may pay particular attention to a dragonfly doji appearing after a downtrend or around an established support area.
However, the pattern itself does not guarantee a bullish reversal.
4. Gravestone Doji
A gravestone doji is effectively the opposite shape.
The open and close are near the low of the candle, while a long upper wick extends above them.
Buyers pushed price higher during the period but were unable to hold those gains. Sellers subsequently pushed price back towards its opening level.
When this appears following an extended rise or around resistance, some traders interpret it as evidence that bullish momentum could be weakening.
Again, confirmation matters.
5. Four-Price Doji
The four-price doji is the most extreme variation.
The:
- open
- high
- low
- close
are all at the same price.
Instead of a cross, the candle appears as a single horizontal line.
This means virtually no price movement occurred during the entire period and is more likely to occur in an extremely quiet or illiquid market.
Is a Doji Bullish or Bearish?
A doji is neither inherently bullish nor bearish.
Its meaning depends heavily on context.
Consider the same standard doji appearing in three different situations.
| Where the Doji Appears | What It Could Indicate |
| After a strong uptrend | Buyers may be losing momentum |
| After a strong downtrend | Selling pressure may be weakening |
| During sideways consolidation | Existing market indecision may simply be continuing |
This is why identifying the candle without examining the surrounding chart provides limited information.
A doji after ten consecutive bullish candles is telling you something very different from a doji appearing in the middle of a narrow trading range containing several other small candles.
Context gives the doji meaning.
How Beginners Can Read a Doji Step by Step
Instead of seeing a doji and immediately trying to predict a reversal, beginners can use a simple process.
Step 1: Identify the Existing Trend
First, zoom out.
Is price:
- making higher highs and higher lows?
- making lower highs and lower lows?
- moving sideways?
This establishes the market structure before the doji appears.
A potential reversal pattern has considerably less meaning if there is no trend to reverse.
Step 2: Look at Where the Doji Formed
Location matters.
Has the doji appeared around a previous swing high, swing low, support zone or resistance zone?
For example, a doji forming around an established resistance area after a sustained rally provides more context than one appearing randomly halfway between major price levels.
Step 3: Examine the Wicks
Don’t only look at the small body.
The wicks reveal where price travelled before returning towards the opening price.
A long upper wick shows that higher prices were rejected during the period.
A long lower wick shows that price traded significantly lower before recovering.
Long wicks on both sides show that both buyers and sellers moved the market but neither retained control.
Step 4: Wait for the Candle to Close
A candlestick pattern is not complete until its timeframe has ended.
A candle that resembles a doji halfway through a one-hour period could develop into a large bullish or bearish candle before that hour finishes.
Beginners should therefore distinguish between a forming doji and a completed doji.
Step 5: Look for Confirmation
The next candle can provide useful additional information.
For example, imagine a doji forms after an uptrend near resistance.
If the next candle falls and closes below the doji, that provides more evidence that buying momentum has weakened.
If instead the next candle breaks strongly above the doji and resistance, the previous indecision may have resolved in favour of buyers.
Traders can also compare price action with momentum tools. For example, our guide to bullish and bearish RSI divergence explains how price movement can be compared with changes in momentum.
The important point is that confirmation adds evidence. It does not create certainty.
How Reliable Is a Doji Candlestick?
A doji is often introduced as a potential reversal signal, but traders should be careful not to confuse recognising indecision with predicting direction.
Research into candlestick patterns has produced mixed results.
A study of candlestick patterns across 349 stocks published in The Quarterly Review of Economics and Finance tested several bullish and bearish candlestick signals, including doji. The researchers found little evidence that the candlestick methods tested provided useful predictive information.
However, other research suggests the answer is more complicated than simply saying candlestick patterns work or do not work.
A 2015 study published in the Journal of Banking & Finance tested candlestick strategies using different definitions of market trends and different holding strategies. The researchers found that the way a candlestick strategy was constructed had a significant effect on its profitability. Certain three-day reversal strategies produced positive results after accounting for transaction costs and data-snooping bias, while others did not.
This reinforces an important point for beginners: the appearance of a candlestick alone may not be enough to establish a trading edge.
There is also some interesting recent data specifically concerning doji.
A large-scale test of 79,778 doji patterns analysed 758,032 daily trading sessions across 153 S&P 500 stocks between 2005 and 2024.
Five trading sessions after a doji appeared, the market had closed higher 55.1% of the time.
At first glance, that might sound like a bullish signal.
However, across all trading sessions in the same dataset, regardless of whether a doji appeared, the market was higher five sessions later 54.7% of the time.
That leaves a difference of only around 0.3 percentage points.
The mean five-day return following a doji was also 0.34%, compared with 0.31% across the complete sample. The researchers reported a two-sided p-value of 0.076, meaning the difference did not meet the conventional 5% threshold for statistical significance.
Importantly, this does not prove that a doji has no value in every market or trading strategy. The test covered large-cap US stocks, daily candles and a five-session holding period. It did not test forex, commodities, indices or intraday charts, nor did it test doji combined with support and resistance, market structure or momentum indicators.
What it does demonstrate is why traders should be cautious about treating a doji as a standalone directional signal.
A doji can tell you something useful about the period that has just ended: buyers and sellers moved price, but neither side was able to establish lasting control by the close.
What happens next still depends on the wider market context.
That is why traders may look at where the doji formed, the preceding trend, support and resistance, its wick structure and subsequent price action before deciding whether the pattern is significant.
Using Doji With Other Technical Analysis
Rather than treating a doji as a standalone trading system, traders can use it as one piece of a wider analysis.
Support and Resistance
A doji forming around an established support or resistance area can highlight a point where the balance between buyers and sellers is changing.
Market Structure
Consider whether price is trending or ranging and where the doji sits within that structure.
A doji appearing after an extended move into an important swing level may deserve more attention than one forming in the middle of a range.
Momentum
Indicators can provide a different type of information.
For example, RSI measures the strength of recent upward movements relative to downward movements, while MACD compares shorter and longer exponential moving averages.
Our RSI vs MACD comparison explains how the two indicators measure momentum differently.
The aim isn’t to keep adding indicators until something agrees with your trade. Instead, different tools should answer different questions.
The doji tells you about the relationship between the open, close, high and low.
Market structure tells you about the broader direction of price.
Momentum indicators tell you about the strength or rate of recent price movements.
Together, they provide more context than any one signal alone.
Common Doji Mistakes Beginners Make
Assuming Every Doji Means Reversal
This is probably the biggest mistake.
A doji signals indecision, not an inevitable reversal.
Sometimes the existing trend resumes immediately afterwards.
Ignoring the Existing Trend
Candlestick patterns should not be viewed in isolation.
Always look at what happened before the candle appeared.
Ignoring the Wicks
Two doji can have identical opening and closing prices but tell very different intraperiod stories.
A dragonfly and gravestone doji demonstrate this perfectly.
Trading Before the Candle Closes
Candles constantly change while they are forming.
Wait until the period has finished before deciding whether the pattern actually exists.
Treating a Doji as a Complete Strategy
A doji does not tell you how much to risk, where to exit or whether the market will reverse.
Pattern recognition should form part of a broader trading process rather than replacing one.
Practising Doji Candlestick Analysis
One of the easiest ways for beginners to understand doji is to observe them on historical charts before considering live trading.
Choose a market and timeframe, then scroll backwards through the chart.
Each time you find a doji, record:
- the trend before it
- whether it appeared near support or resistance
- the type of doji
- the length and direction of its wicks
- what the next candle did
- what happened over the following five or ten candles
This exercise quickly demonstrates why two visually similar doji can produce completely different outcomes.
A demo account can also be used to observe candlestick formations in live market conditions without risking real capital.
Trading Doji Candlestick Patterns With LQH Markets
Doji candlesticks can appear across forex, indices, commodities, stocks and cryptocurrency markets.
LQH Markets provides access to these markets through MetaTrader 5, where traders can use candlestick charts across multiple timeframes and combine price action with technical indicators.
Beginners can use a demo account to practise identifying standard, long-legged, dragonfly and gravestone doji, then observe how each behaves within different market structures.
The objective should not be to find a candlestick pattern that predicts every market move. Instead, learning to read candles can help you understand how price behaved during a particular period and incorporate that information into a broader analytical process.
Ready to get started? Open a live LQH Markets account or start with a demo account.
Risk disclaimer
CFDs are complex instruments with a high risk of losing all your invested capital. Only trade with money you can afford to lose. Content is for general information only and is not investment advice.
Final Thoughts
A doji candlestick forms when a market opens and closes at the same or almost the same price.
Its small body makes it easy to recognise, but interpreting it correctly requires more than spotting a cross on a chart.
Remember:
- a doji primarily represents indecision
- it is not automatically bullish or bearish
- its position within the broader trend matters
- its wicks provide information about what happened during the period
- dragonfly, gravestone and long-legged doji tell different price-action stories
- waiting for the candle to close prevents premature identification
- subsequent price action can provide confirmation
- a doji alone does not reliably predict the market’s next direction
For beginners, the most useful question is therefore not simply “Is that a doji?”
It is:
“Where has this doji formed, what happened inside the candle, and what does price do next?”
That turns candlestick recognition into market analysis.
Doji Candlestick FAQs
A doji candlestick means the opening and closing prices for a period were identical or very close. It is commonly interpreted as market indecision because neither buyers nor sellers managed to establish lasting control by the close.
A doji is not inherently bullish or bearish. Its interpretation depends on where it forms, the preceding trend, the shape of its wicks and subsequent price action. A doji after an uptrend may indicate weakening buying pressure, while one after a downtrend may indicate weakening selling pressure.
No. A doji can appear before a reversal, but it can also be followed by continuation or sideways movement. Research into candlestick patterns has produced mixed evidence about their predictive power, which is why traders often seek additional confirmation.
A standard doji typically has wicks above and below its opening and closing price. A dragonfly doji has a long lower wick with the open and close near the high of the period. It shows that price moved lower before recovering towards its opening level.
Rather than immediately entering a trade, beginners can first identify the existing trend, check whether the doji has formed near an important price level, examine its wicks and wait for the candle to close. The following price action can then provide additional information about whether the previous trend is continuing or weakening.