
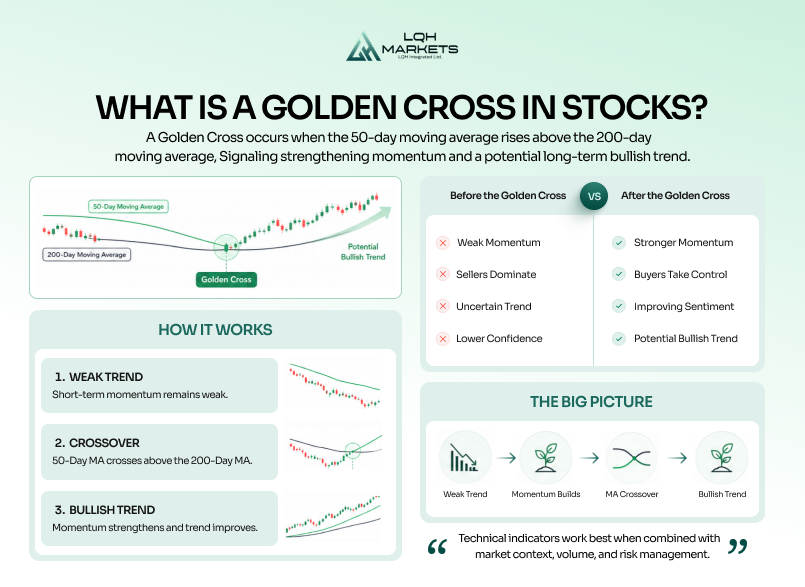
A golden cross in stocks is a technical analysis signal where a short-term moving average, typically the 50-day, crosses above a long-term moving average, usually the 200-day. This crossover indicates that recent price momentum has strengthened enough to shift the broader trend upward, and it is widely interpreted as a sign that a bullish phase may be starting.
In simple terms, a golden cross tells you that short-term buyers are now overpowering the longer-term trend, which often reflects improving sentiment, rising demand, and the possibility of sustained price increases.
What is a golden cross in stocks
At its core, the golden cross is a moving average crossover. Moving averages smooth out price data over time, allowing traders to identify trends without the noise of daily fluctuations. When two moving averages are plotted together, their interaction reveals how short-term price behaviour compares to long-term direction.
A golden cross occurs specifically when:
- The short-term average (most commonly 50 days) rises above
- The long-term average (most commonly 200 days)
Before the crossover happens, the short-term average sits below the long-term average, reflecting weaker recent price action. When it crosses above, it signals that recent prices have strengthened enough to change the overall trend structure.
This is why the golden cross is considered a trend reversal or trend confirmation signal, depending on how it is interpreted. It does not predict the future in isolation. Instead, it reflects what has already changed in the underlying price dynamics.
This concept is widely recognised in financial research and technical analysis. For example, the CFA Institute explains that moving averages are commonly used to identify trend direction and confirm momentum shifts in financial markets.
Why the golden cross matters in stocks
The golden cross matters because it captures a structural shift in supply and demand.
When the crossover happens, several underlying conditions are usually present:
- Prices have been rising consistently
- Buyers are becoming more aggressive
- Sellers are losing control
- Market sentiment is improving
Because the 200-day moving average represents roughly 40 weeks of price data, crossing above it suggests that recent strength is strong enough to influence the long-term trend.
This is why many investors interpret the golden cross as a signal that a bull market or extended uptrend could be underway.
Research from the Federal Reserve Board shows that momentum-based strategies, which are closely related to long-horizon moving averages such as the 200-day, are used to identify persistent trends and changing market conditions rather than predict reversals.
However, it is important to be precise here. The golden cross does not cause prices to rise. It reflects that prices have already been rising in a way that changes the structure of the trend.
How a golden cross forms
A golden cross is not a single moment. It is the result of a process that unfolds over time. Most authoritative explanations break it into three stages.
1. Downtrend exhaustion
Before a golden cross can occur, the market is usually in a downtrend. During this phase:
- The 50-day moving average sits below the 200-day
- Both averages may be declining
- Selling pressure dominates
As the downtrend matures, selling begins to weaken. Prices stabilise, and the short-term average flattens.
2. The crossover
This is the defining moment. The 50-day moving average crosses above the 200-day moving average.
This happens because recent prices have been rising consistently enough to pull the short-term average upward faster than the long-term average.
At this point, the signal becomes visible on the chart and is often interpreted as bullish.
3. Uptrend confirmation
After the crossover:
- The 50-day average remains above the 200-day
- Prices continue rising
- The long-term trend shifts upward
This stage is where the golden cross is often validated. The market is no longer just stabilising. It is trending higher. These three stages are widely recognised in technical analysis literature and reinforce that the golden cross is a lagging indicator, not an early signal.
What a golden cross tells you about a stock
A golden cross provides information about momentum, trend strength, and market psychology.
Momentum is shifting upward
The most immediate takeaway is that short-term price momentum is now stronger than the long-term average. This indicates that buyers are becoming more aggressive.
The trend may be changing
Because the 200-day moving average is a widely used proxy for the long-term trend, crossing above it suggests that the stock may be transitioning from bearish or neutral to bullish conditions.
Market sentiment is improving
Technical indicators often reflect underlying psychology. A golden cross implies:
- Increasing confidence among investors
- Greater willingness to buy at higher prices
- Reduced selling pressure
Institutional attention increases
Large funds and algorithmic strategies often track major moving averages. When a golden cross appears, it can attract additional capital simply because many participants are watching the same signal.
Golden cross vs moving average crossover
Not every moving average crossover is a golden cross. The term has a specific meaning. Any two moving averages can cross. For example:
- 10-day crossing 20-day
- 20-day crossing 50-day
These are still crossovers, but they are not considered golden crosses.
The golden cross is typically reserved for the 50-day and 200-day combination, because:
- It balances short-term and long-term perspectives
- It has historical significance
- It is widely followed across markets
This widespread use contributes to its importance. When many traders watch the same signal, it can influence behaviour and liquidity.
Golden cross vs death cross
To fully understand the golden cross, it helps to contrast it with its opposite: the death cross.
- Golden cross: 50-day crosses above 200-day, bullish signal
- Death cross: 50-day crosses below 200-day, bearish signal
The two patterns are structurally identical but reflect opposite market conditions.
A death cross indicates weakening momentum and potential downtrend continuation, while a golden cross indicates strengthening momentum and potential uptrend continuation.
Together, they form a basic framework for identifying long-term trend shifts in stocks.
Is the golden cross a reliable signal
The golden cross is widely respected, but it is not foolproof.
It is a lagging indicator
Because moving averages are based on past prices, the signal appears after the trend has already begun. By the time the crossover occurs, the stock may have already risen significantly. This means:
- It does not catch the bottom
- It confirms a trend rather than predicting it
Research published by the National Bureau of Economic Research shows that trend following strategies based on moving averages tend to capture sustained trends but do not predict turning points.
It works best in trending markets
The golden cross performs more effectively when markets are trending strongly. In sideways or choppy conditions, moving averages can cross repeatedly, producing false signals.
It reflects probability, not certainty
Even though the golden cross is often associated with bullish outcomes, it does not guarantee future gains. It simply indicates that conditions are aligned for a potential continuation of upward momentum.
Once you’ve identified a potential Golden Cross setup, it’s important to plan the trade before entering. Our Position Size Calculator and Profit & Loss Calculator can help you manage risk and estimate potential outcomes based on your chosen entry and exit levels.
Why traders and investors watch it
Despite its limitations, the golden cross remains one of the most followed indicators in stock markets.
It simplifies trend analysis
Instead of analysing complex price action, traders can quickly assess whether a stock is in a bullish or bearish phase based on the relationship between two averages.
It provides a common reference point
Because it is widely used, the golden cross acts as a shared signal across the market. This can create feedback effects where:
- More buyers enter after the signal
- Momentum strengthens further
It aligns with long-term investing
Many long-term investors use the 200-day moving average as a baseline for trend direction. The golden cross fits naturally into this framework, making it relevant beyond short-term trading.
Common misconceptions about the golden cross
It predicts future price increases
This is incorrect. The golden cross reflects past price strength. It suggests a higher probability of continued upward movement, but it does not guarantee it.
It is a standalone strategy
Relying solely on the golden cross is risky. Most experienced traders use it alongside:
- Volume analysis
- Support and resistance
- Broader market conditions
It works the same in all timeframes
A golden cross on a daily chart carries far more significance than one on a 5-minute chart. The timeframe determines the reliability and meaning of the signal.
How the golden cross is used in stocks
In practice, the golden cross is used in several ways.
As a trend filter
Investors may only buy stocks that are above their 200-day moving average and have formed a golden cross, ensuring they are aligned with the broader trend.
As confirmation
Rather than entering immediately at the crossover, traders may wait for additional confirmation, such as:
- Breakouts above resistance
- Increased trading volume
As part of a system
The golden cross is often combined with other indicators to build a more robust strategy. On its own, it is simply one piece of information.
Using golden cross signals on LQH Markets
A signal like the golden cross is only useful if your platform gives you the tools to analyse trend structure properly and execute without friction. On LQH Markets, every MetaTrader 5 chart supports the moving averages, indicators, and timeframe flexibility traders use to identify momentum shifts and long-term trend changes. Whether you’re tracking a 50-day and 200-day crossover on stocks, indices, forex, or crypto CFDs, the charting environment is built for active technical analysis rather than basic price viewing.
You can trade global markets from a single MT5 account, with stop loss and take profit functionality built directly into every order ticket. Position sizing, trade management, and multi-device access are all integrated into the same platform, so strategies based on trend continuation and momentum can be monitored and executed without switching between systems.
If you’re still learning how moving average crossovers behave in live market conditions, the demo environment runs the same MT5 infrastructure with real market pricing. Useful for testing how golden crosses form, how false signals develop, and how trend confirmation behaves before risking capital in a live market.
LQH Markets supports crypto-funded trading accounts, allowing traders to deposit with selected cryptocurrencies for a faster and more flexible funding experience.
Open an account or start with a demo.
Risk disclaimer
CFDs are complex instruments with a high risk of losing all your invested capital. Only trade with money you can afford to lose. Content is for general information only and is not investment advice
Final thoughts
A golden cross in stocks is a widely recognised bullish signal formed when the 50-day moving average crosses above the 200-day moving average, indicating that short-term momentum has overtaken the long-term trend. It reflects improving sentiment, strengthening demand, and the potential for a sustained uptrend, but it does not guarantee future performance.
Understanding the golden cross properly means recognising what it actually does. It does not predict turning points. It confirms that a shift has already occurred. Used in that context, it becomes a powerful tool for identifying when a stock has moved from weakness into strength and when the broader market structure is beginning to favour buyers.
FAQ
A golden cross is not a strategy on its own, but it can be a useful trend confirmation tool within a broader trading or investing approach. It works best in trending markets where momentum continues after the crossover. However, because it is a lagging indicator, it often appears after a stock has already moved higher. Most experienced traders use it alongside other signals such as volume, support and resistance, or macro conditions rather than relying on it in isolation.
After a golden cross forms, the stock often enters a sustained uptrend, where prices continue making higher highs and higher lows. This reflects continued buying pressure and improving sentiment. However, the outcome is not guaranteed. In strong market conditions, the trend can persist for months or longer, but in volatile or sideways markets, the signal can fail, leading to a reversal or consolidation instead of continued growth.
When a stock forms a golden cross, it signals that short-term momentum has overtaken the long-term trend, which is typically interpreted as bullish. This often attracts attention from traders and institutional participants who monitor long-term moving averages. As a result, buying interest can increase, reinforcing the upward move. The key detail is that the signal reflects a shift that has already begun, not a prediction of future performance.
The golden cross is considered a reliable trend-following signal in strong markets, but it is not foolproof. Its effectiveness depends heavily on market conditions. In trending environments, it can help identify sustained upward moves. In choppy or sideways markets, it can produce false signals due to frequent moving average crossovers. Its reliability improves when combined with other indicators rather than used alone.
A golden cross and a death cross are opposite signals based on the same concept. A golden cross occurs when the 50-day moving average crosses above the 200-day, indicating bullish momentum. A death cross occurs when the 50-day crosses below the 200-day, signalling potential weakness or a bearish trend. Together, they are used to identify major shifts in long-term market direction.