


Copper, often dubbed “Dr. Copper” for its uncanny ability to forecast economic health, stands as a pivotal industrial metal. Its price movements frequently offer early insights into global manufacturing activity and broader economic trends, making it an indispensable indicator for investors and policymakers alike. However, the traditional narrative of copper as a pure cyclical barometer is evolving, influenced by a powerful new demand driver: the global energy transition.
Copper is a non-ferrous industrial metal widely regarded as a leading indicator of global economic health due to its pervasive use across manufacturing, construction, and infrastructure sectors. Its price movements reflect physical consumption, providing a real-time pulse on industrial activity and future economic expectations.
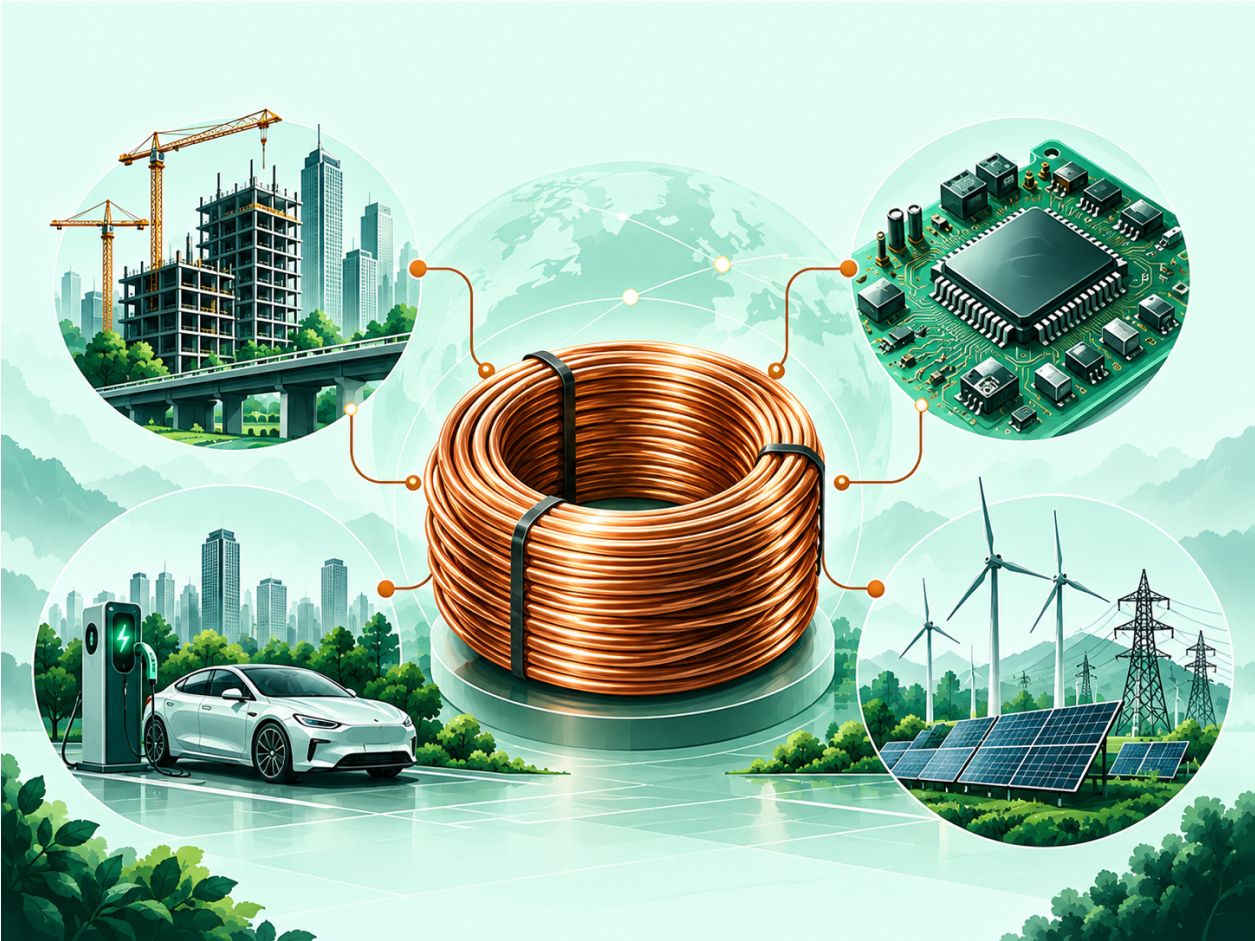
The Enduring Legacy of “Dr. Copper”
For decades, copper has earned its moniker as the “metal with a PhD in economics.” This reputation stems from its deep correlation with global industrial production and Gross Domestic Product (GDP). Historically, a 1% shift in global GDP has been associated with an approximate 1.2% change in copper demand growth. Data consistently shows a strong correlation, often in the 0.65-0.75 range, between copper prices and key industrial output indices over multi-year periods.
This relationship is rooted in copper’s fundamental role in nearly every industrial process. When factories ramp up production, construction projects break ground, and consumer goods demand rises, copper is a critical input. Its price reflects this physical consumption, offering a cleaner signal of real-economy activity compared to assets heavily influenced by financial flows or speculative sentiment alone.
Ubiquitous Demand: Where Copper Powers the Economy
Copper’s widespread utility makes it an aggregated signal for dozens of end-use industries. Its exceptional conductivity, malleability, and corrosion resistance make it indispensable:
- Construction: Electrical wiring, plumbing systems, roofing, and architectural elements in residential, commercial, and industrial buildings.
- Manufacturing: Motors, transformers, generators, and various machinery components across diverse sectors.
- Transportation: Wiring harnesses, radiators, and electronic components in automobiles, trains, and aircraft.
- Electronics: Printed circuit boards, connectors, and semiconductors in consumer electronics and high-tech equipment.
- Power Generation & Transmission: Essential for power plants, substations, and the vast network of electrical grids that deliver energy.
When global manufacturing accelerates, demand for these copper-intensive products surges, driving prices higher. Conversely, a slowdown in industrial activity typically leads to reduced demand and downward pressure on prices.
The New Frontier: Copper and the Energy Transition
While its cyclical nature remains important, copper’s demand profile is experiencing a structural transformation driven by the global push towards decarbonization. This “green transition” is layering a significant new source of demand that is increasingly decoupling from traditional industrial cycles.
- Electric Vehicles (EVs): EVs require substantially more copper than conventional internal combustion engine (ICE) vehicles. An average EV uses roughly 80-100 kilograms of copper, three to four times more than an ICE vehicle, primarily for batteries, motors, and charging infrastructure.
- Renewable Energy Infrastructure: Solar panels, wind turbines, and geothermal systems are highly copper-intensive. The expansion of renewable energy capacity globally translates directly into increased copper demand for wiring, inverters, and grid connections.
- Grid Modernization and Expansion: To integrate intermittent renewable energy sources and support the electrification of transport, power grids worldwide require significant upgrades and expansion. This involves thousands of miles of new transmission lines and smart grid technologies, all relying heavily on copper.
Projections indicate that energy-transition related copper demand could more than double by 2035. This structural shift provides a robust demand floor for copper, meaning that even during periods of traditional industrial slowdown, green transition projects can help sustain prices. “Dr. Copper” is no longer just diagnosing the industrial cycle; it is also prescribing the green transition, sometimes pulling in opposite directions.
Supply-Side Rigidity and Geopolitical Factors
Unlike demand, which can shift relatively quickly, copper supply is inherently inflexible and prone to disruption. This rigidity amplifies price movements when demand surges.
- Long Development Cycles: Developing a major copper mine is a capital-intensive, multi-decade endeavor, often taking 10-15 years from discovery to full production. This makes rapid supply responses to demand spikes extremely challenging.
- Declining Ore Grades: Over the past two decades, average ore grades have steadily declined, meaning more material must be mined and processed to extract the same amount of copper, increasing costs and environmental impact.
- Geographic Concentration and Political Risk: Copper production is heavily concentrated in a few regions, notably Chile and Peru, which together account for over 40% of global supply. This concentration makes the market vulnerable to local events such as labor strikes, environmental regulations, water shortages, or political instability that can halt or reduce output.
- Infrastructure Investment: The significant infrastructure required for mining, processing, and transporting copper also presents bottlenecks.
These supply constraints mean that even modest increases in demand can create significant ripples in the market, leading to sharper price increases than might be expected.
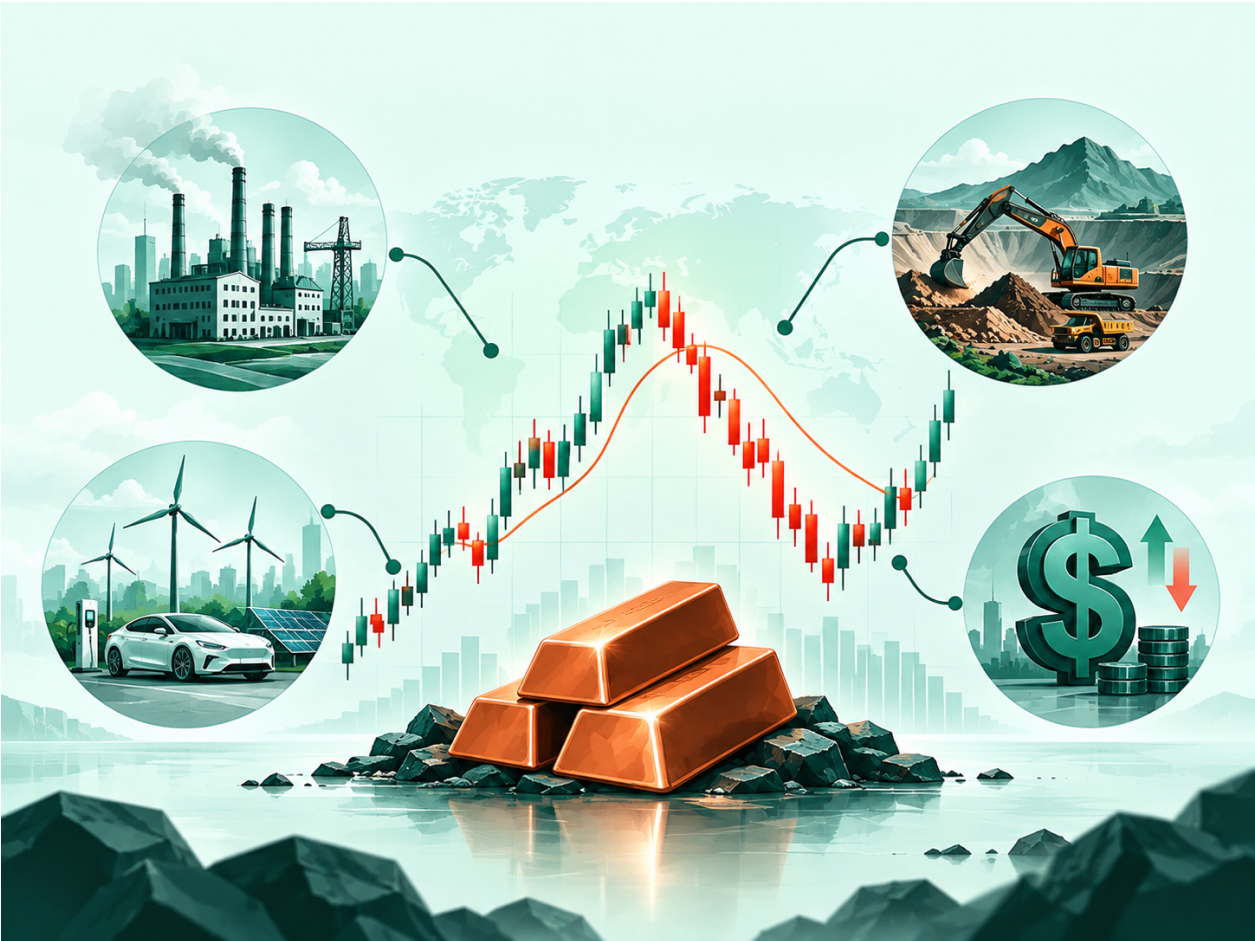
Tracking the Pulse: Key Market Indicators
To effectively analyze copper markets, traders and investors monitor a combination of macroeconomic data and physical indicators:
Economic Data and Sentiment
Copper is highly sensitive to overall financial conditions, interest rates, and capital spending.
- Purchasing Managers’ Indices (PMIs): These surveys of manufacturing and services sectors offer early insights into economic trends and future copper consumption. Rising PMIs often signal an upcoming surge in industrial demand.
- Credit Growth and Fixed-Asset Investment: These indicators reflect investment in infrastructure and industrial capacity, which are direct drivers of copper demand.
- The US Dollar (USD) Dynamics: As copper is priced in USD, a stronger dollar makes the metal more expensive for international buyers, potentially dampening demand. Conversely, a weaker dollar can make copper more attractive. However, strong global economic growth can often outweigh currency effects.
China’s Outsized Influence
China accounts for approximately half of global refined copper consumption. Consequently, Chinese economic data holds immense sway over copper prices.
- Industrial Output and Construction Activity: These metrics directly impact China’s copper consumption.
- Infrastructure Budgets: Large-scale government-led infrastructure projects, particularly those related to renewable energy and grid expansion, can significantly boost demand.
Inventory Levels
Physical inventory levels held on major exchanges provide a snapshot of market tightness.
- London Metal Exchange (LME), Shanghai Futures Exchange (SHFE), and COMEX: Monitoring stock levels in these warehouses helps gauge the balance between supply and demand. Sharp inventory draws suggest tightening supply, while persistent builds indicate potential oversupply.
The Copper-to-Gold Ratio: A Refined Macro Signal
Beyond individual metal prices, the copper-to-gold ratio offers a sophisticated lens into global economic sentiment. This ratio helps filter out monetary and safe-haven flows that often influence gold, providing a cleaner read on industrial activity and investor risk appetite. Historically, a rising copper-to-gold ratio has correlated with increasing economic optimism and higher interest rates, such as the 10-year US Treasury yield. This is because copper, driven by pure physical industrial consumption, is inherently more cyclical than gold, which benefits from its monetary and safe-haven demand during uncertainty. While a powerful tool, no single ratio is infallible; correlations can shift, as evidenced by the breakdown observed in 2022-2023.
Understanding Futures Curves: Forward Signals
The copper futures market offers additional layers of insight into market expectations. The shape of the futures curve reflects anticipated supply tightness, economic growth, and investor sentiment.
- Backwardation: Occurs when near-term futures prices are higher than longer-dated contracts. This typically signals tight immediate supply or strong current demand, indicating that the market values prompt delivery more highly. Traders might benefit from a positive roll yield in this scenario.
- Contango: Characterized by longer-dated futures prices being higher than near-term prices. Contango usually suggests ample supply, weaker immediate demand, or higher carrying costs. Rolling contracts forward in a contango market can incur costs, potentially creating a drag on returns.
By analyzing the futures curve alongside macroeconomic trends and inventory data, traders can gain a more nuanced understanding of market sentiment and potential future price movements.
Gaining Exposure to Copper through CFDs
Broader Avenues for Copper Exposure
While CFDs offer a flexible way to trade copper, investors and traders can gain exposure through several other avenues:
- Futures Contracts: These provide highly liquid, leveraged exposure to copper prices, suitable for precise directional bets. However, they come with significant volatility, margin requirements, and the complexities of roll costs and curve dynamics.
- Mining Companies: Investing in shares of copper-producing companies offers operational leverage, meaning their profits can be magnified when copper prices rise. This approach, however, introduces company-specific risks such as political instability, operational disruptions, labor disputes, or project execution challenges.
- Exchange-Traded Funds (ETFs): Copper ETFs offer a diversified, often lower-risk option by holding baskets of mining stocks, futures contracts, or both. This diversification helps mitigate single-company or single-contract risk.
It’s also important to note that copper prices can diverge between major exchanges like the London Metal Exchange (LME), COMEX, and the Shanghai Futures Exchange (SHFE). This can be due to local factors such as trade policies, regional supply constraints, or differing demand patterns, underscoring the need to monitor global market dynamics.
For traders seeking to capitalize on copper’s price movements without the complexities of physical commodity ownership or direct futures trading, Contracts for Difference (CFDs) offer a flexible solution. CFDs allow you to speculate on the rising or falling price of copper, with the potential for leverage to amplify returns (and risks).
Example:
Imagine you observe strong global PMI data, increasing infrastructure spending in major economies, and a persistent decline in LME copper inventories. You anticipate copper prices will rise.
- Trading with CFDs: You could open a ‘buy’ position on a copper CFD. If copper’s price rises by $0.10 per pound, and your CFD contract is for 10,000 pounds, your profit would be $1,000 (excluding commissions/spreads). Conversely, if the price falls, you would incur a loss.
- Leverage: CFDs typically offer leverage, meaning you can control a larger position with a smaller initial capital outlay. While this can magnify profits, it also significantly increases potential losses, making robust risk management crucial.
CFDs provide a way to gain exposure to copper’s price dynamics, whether driven by cyclical industrial demand or the structural forces of the energy transition, allowing for agile responses to market shifts.
Navigating Copper’s Nuances: Beyond the Bellwether
Copper’s Evolving Regimes: A Historical Lens
To fully grasp copper’s complex signals, it’s helpful to view its market dynamics through distinct historical “regimes”:
- Pre-2003 (Industrial-Pure Regime): In this era, copper prices exhibited a tight correlation with global industrial production, serving as a relatively clean and straightforward cyclical signal for economic health.
- 2003-2020 (China Supercycle & Global Liquidity Regime): China’s unprecedented, double-digit economic growth introduced a massive new layer of demand, often amplified by global liquidity. This period saw increased volatility but generally preserved copper’s directional information as a robust growth indicator.
- Post-2022 (Energy Transition Regime): The current era is defined by the emergence of substantial, structural demand from electric vehicles (EVs) and grid modernization projects. This provides a significant structural floor for prices, increasingly decoupling copper from traditional industrial cycles. “Dr. Copper” now offers dual prescriptions, sometimes pulling in opposite directions, making its signals more nuanced and complex than ever before.
While “Dr. Copper” provides invaluable signals, it’s essential to recognize its limitations. The metal’s track record as a binary recession predictor is not absolute, with instances of false signals or missed turns. The structural demand from the energy transition further complicates this, as copper prices may remain supported even when traditional industrial demand softens.
Therefore, copper is best viewed as one critical input in a broader analytical framework. Monitoring its price alongside other base metals like aluminum, zinc, and nickel can provide a more robust cyclical signal when the entire complex moves in unison. Traders should ask themselves whether their exposure reflects a purely cyclical thesis, a structural energy-transition thesis, or a combination of both.
Ultimately, understanding copper means understanding the rhythm of the global economy and the powerful, evolving expectations driving it.
Frequently Asked Questions
How has the energy transition impacted copper’s role as an economic indicator?
The energy transition has introduced a significant structural demand layer for copper, particularly from electric vehicles and renewable energy infrastructure. This means copper’s price movements now reflect both traditional industrial cycles and this new, often insulated, demand, making its signals more complex than in previous decades.
Why is China’s economy so critical for global copper prices?
China is the world’s largest consumer of refined copper, accounting for approximately half of global demand. Its property cycles, infrastructure investment plans, and manufacturing output have an outsized influence on global copper demand and, consequently, on international copper prices.
What is the difference between backwardation and contango in copper futures?
Backwardation occurs when near-term copper futures prices are higher than longer-dated contracts, typically signaling tight supply or strong immediate demand. Contango, conversely, is when longer-dated futures prices are higher than near-term prices, often indicating ample supply or weaker current demand.
Can copper be considered an inflation hedge?
Historically, copper has shown a positive correlation with inflation, making it an attractive inflation hedge. Its pervasive use in the global economy allows producers to pass rising costs through the supply chain, often leading copper prices to rise before general consumer prices.
Knowledge Check
1. Which of the following best describes the “Dr. Copper” phenomenon?
- A) Copper’s price movements are primarily driven by speculative financial flows.
- B) Copper’s price historically correlates with global industrial activity and GDP, acting as an economic bellwether.
- C) Copper’s price is solely determined by the supply-demand balance in the jewelry market.
- D) Copper is a reliable binary predictor of stock market crashes.
2. What new structural demand layer is significantly influencing copper prices?
- A) Increased demand for copper in traditional consumer electronics.
- B) A surge in the use of copper for decorative purposes.
- C) The global energy transition, driven by electric vehicles, renewable energy, and grid modernization.
- D) A decrease in mining costs leading to lower production prices.
3. If the copper futures curve is in backwardation, what does this typically suggest about market conditions?
- A) There is an abundant supply of copper, and demand is weak.
- B) Longer-dated contracts are more expensive than near-term contracts, indicating higher carrying costs.
- C) Near-term supply is tight, or immediate demand is strong.
- D) The market expects a significant price decline in the near future.
Click to view the answers
1. **B)** – Copper’s nickname “Dr. Copper” reflects its historical correlation with global industrial activity and GDP, making it a leading economic indicator.
2. **C)** – The global energy transition, with its demand from EVs, renewables, and grid upgrades, is a major new structural driver for copper prices.
3. **C)** – Backwardation in the futures curve typically indicates that near-term supply is tight or immediate demand is strong, causing prompt prices to be higher.