


In the dynamic landscape of global finance, investors and traders constantly seek sophisticated instruments to capitalize on market movements. Among these, the Index Contract for Difference (CFD) stands out as a powerful and versatile derivative, offering a unique pathway to engage with broad market segments without the complexities of direct asset ownership. This comprehensive guide delves into the essence of Index CFDs, exploring their mechanics, historical context, advantages, risks, and strategic applications.
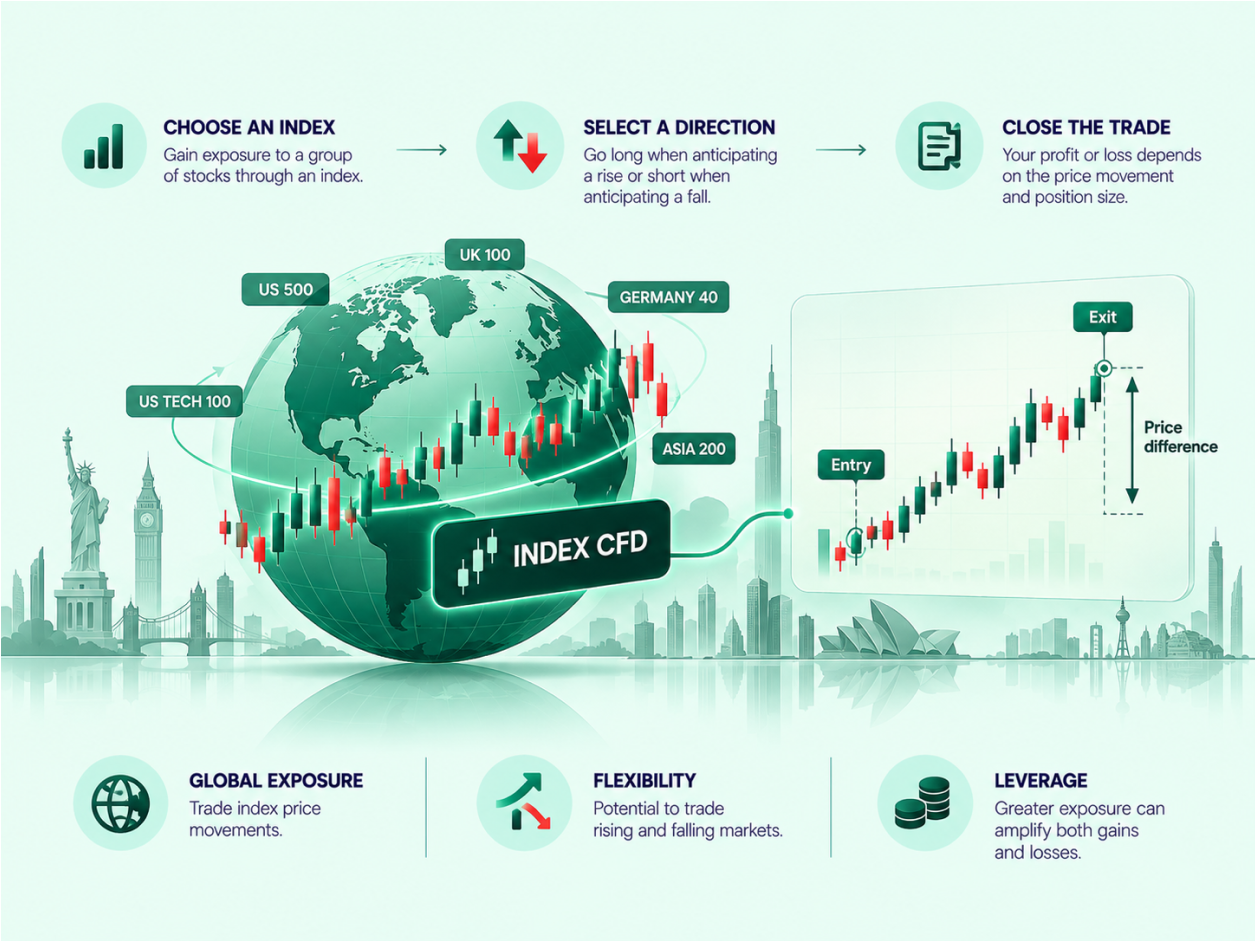
An Index CFD (Contract for Difference) is a derivative financial instrument allowing traders to speculate on the price movements of a stock market index without owning the underlying assets. It enables participation in broad market trends, offering flexibility to profit from both rising and falling markets.
Understanding Stock Market Indices
Before dissecting Index CFDs, it’s crucial to grasp what a stock market index represents. An index is essentially a statistical measure that tracks the performance of a selection of stocks from a specific market, sector, or economy. Think of it as a barometer or a thermometer for a particular segment of the financial world.
What are Indices?
Indices are single markets composed of a curated selection of stocks. Their price tracks the combined value of every stock listed within them, often reflecting the health and sentiment of an entire economy or industry. For instance, the S&P 500 tracks 500 of the largest U.S. companies, providing a broad snapshot of the American equity market.
Stock Exchanges vs. Stock Indices: It’s important to distinguish between a stock exchange and a stock index. A stock exchange (like the New York Stock Exchange or Nasdaq) is a marketplace where shares are bought and sold, listing thousands of different companies. A stock index, conversely, is a measure derived from a selection of companies listed on one or more exchanges. For example, the Nasdaq is an exchange, while the Nasdaq 100 is an index composed of 100 of the largest non-financial companies listed on that exchange.
The Evolution of Indices: A Brief History
The concept of stock market indices dates back to the late 19th century. Charles Dow, co-founder of Dow Jones & Company and The Wall Street Journal, created the first stock index in 1884, initially comprising 11 stocks (9 railroads and 2 industrials). This evolved into the Dow Jones Industrial Average (DJIA) in 1896, which today tracks 30 significant U.S. companies. Dow’s intention was to provide a simple, at-a-glance measure of economic health.
Later, in 1957, Standard & Poor’s introduced the S&P 500, expanding on earlier indices to include 500 large-cap U.S. companies. This index quickly became a more comprehensive benchmark for the U.S. equity market due to its broader representation and market capitalization weighting. Over time, indices proliferated globally, each designed to capture the performance of specific national markets (e.g., FTSE 100 for the UK, DAX 40 for Germany) or sectors (e.g., Nasdaq 100 for technology).
How Indices are Calculated
Indices employ various methodologies to aggregate the performance of their constituent stocks. The weighting method significantly impacts how individual stock price movements affect the overall index value.
- Market Capitalization-Weighted: This is the most common method, used by indices like the S&P 500, FTSE 100, and DAX 40. In this approach, companies with larger market capitalizations (share price multiplied by the number of outstanding shares) have a greater influence on the index’s value. A 1% movement in a large-cap stock will affect the index more than a 1% movement in a small-cap stock. This method is favored for its reflection of the actual market value of companies.
- Price-Weighted: Only a few prominent indices, notably the Dow Jones Industrial Average and Japan’s Nikkei 225, use this method. Here, stocks with higher share prices have a greater impact on the index, regardless of their market capitalization. For example, if a company with a $300 share price moves by $1, it has a larger effect than a company with a $50 share price moving by $1, even if the latter has a larger overall market value.
- Fundamental Weighting: This less common method weights stocks based on fundamental factors like sales, earnings, dividends, or book value. The idea is to reduce the impact of market sentiment and focus on intrinsic company value.
- Equal Weighting: In an equally weighted index, every stock holds the same significance, regardless of its price or market capitalization. If an index has 100 stocks, each would represent exactly 1% of the index. This method gives smaller companies a disproportionately larger impact compared to market capitalization weighting.
Modern indices also incorporate complex algorithms to account for corporate actions such as stock splits, dividend payments, mergers, and changes in constituent companies. Regular rebalancing ensures the index remains an accurate and relevant representation of its target market segment.
The Dynamic Nature of Index Composition and Rebalancing
Index Composition and Rebalancing
The dynamic nature of stock market indices means their composition is not static. To maintain their relevance and accurately reflect the market segment they represent, indices undergo periodic reviews and rebalancing. This process involves adding new companies, removing others, and adjusting the weighting of existing constituents.
Methodologies and Criteria for Selection:
- Market Capitalization: For many major indices like the FTSE 100, DAX 40, and Euro Stoxx 50, the primary criterion is market capitalization. Companies are ranked by their market value, and the top X companies (e.g., 100 for FTSE 100, 40 for DAX 40) that meet other liquidity and free-float requirements are included.
- Committee Discretion with Rules: Indices like the S&P 500 use a committee-driven approach, but with strict eligibility criteria. These criteria include factors such as U.S. domicile, market capitalization thresholds, liquidity, public float, and sustained profitability (e.g., four consecutive quarters of positive earnings). The committee aims for sector balance and broad market representation, making qualitative judgments alongside quantitative metrics.
- Industry Focus: Indices like the Nasdaq 100 specifically target non-financial companies, emphasizing sectors like technology, biotechnology, and telecommunications. Their selection criteria prioritize companies within these growth-oriented industries.
Frequency of Rebalancing:
Rebalancing typically occurs on a regular schedule, though the frequency varies by index:
- Quarterly: Many major indices, including the S&P 500 and Nasdaq 100, conduct quarterly reviews. These reviews assess whether companies still meet the eligibility criteria and adjust weightings based on updated market capitalizations.
- Annually: Other indices, such as the FTSE 100 and DAX 40, perform a more comprehensive annual review, often supplemented by smaller quarterly adjustments for significant changes.
- Ad-hoc Changes: Changes can also occur outside of scheduled rebalancing periods due to major corporate actions like mergers, acquisitions, bankruptcies, or delistings, which necessitate immediate adjustments to the index composition.
Importance of Rebalancing:
Rebalancing is crucial because it ensures the index remains a true barometer of its target market. Without it, an index could become outdated, failing to reflect new economic realities or the emergence of dominant companies. For traders, rebalancing can create short-term volatility in the prices of stocks being added or removed, as index funds and ETFs that track these indices adjust their portfolios accordingly.
What is a Contract for Difference (CFD)?
A Contract for Difference (CFD) is a popular derivative financial instrument that allows traders to speculate on the rising or falling prices of fast-moving global financial markets, such as shares, commodities, currencies, and indices. When trading a CFD, you enter into an agreement with a broker to exchange the difference in the price of an underlying asset from the time the contract is opened until it is closed.
Crucially, you do not own the underlying asset when trading CFDs. Instead, you are merely speculating on its price movement. This characteristic offers significant flexibility, as traders can profit from both upward (by taking a “long” position) and downward (by taking a “short” position) price trends.
The Power of Leverage
One of the defining features of CFDs is leverage. Leverage enables traders to open larger positions with a relatively small initial capital outlay, known as margin. For example, with 1:20 leverage, a trader might control a $20,000 position in an index CFD by only depositing $1,000 as margin.
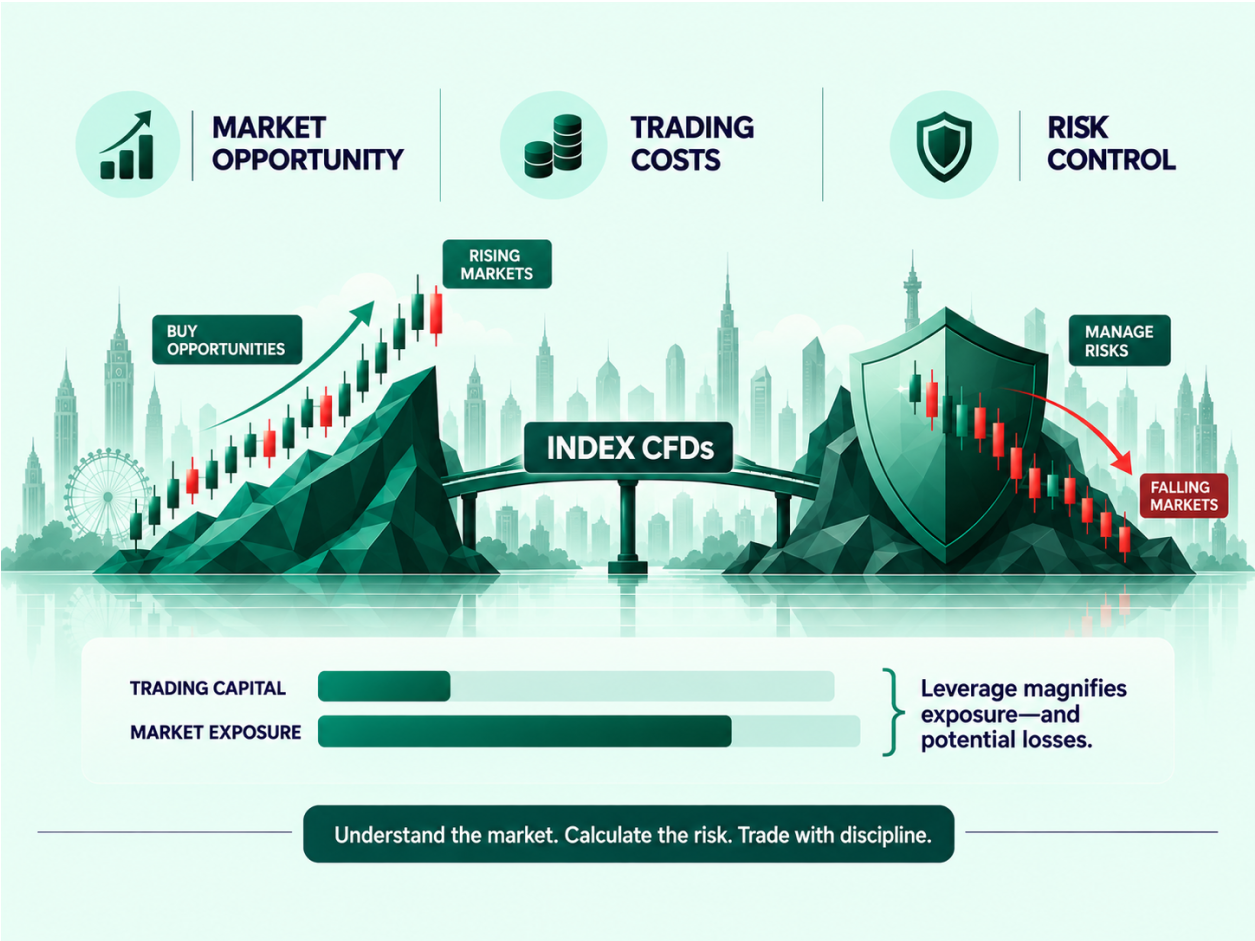
While leverage can amplify potential returns, it also magnifies potential losses. Since profits and losses are calculated based on the full value of the trade, not just the margin, losses can exceed the initial investment. This makes robust risk management an indispensable component of CFD trading.
How Index CFDs Work
An Index CFD combines the broad market exposure of a stock index with the leveraged trading capabilities of a CFD. When you trade an Index CFD, you are essentially entering a contract with your broker to exchange the difference in the index’s value between the moment you open your trade and the moment you close it.
Entering a Position
If you believe a particular index, such as the S&P 500, will rise in value, you would take a long position (buy the Index CFD). Conversely, if you anticipate a decline, you would take a short position (sell the Index CFD).
Let’s illustrate with an example:
Imagine the US 500 Index CFD is trading at 4,500 points. You believe the U.S. economy is strong and the index will rise. You decide to buy 10 contracts of the US 500 Index CFD, where each contract is valued at $1 per point.
- Initial Position: 10 contracts x $1/point = $10 per point movement.
- Entry Price: 4,500 points.
- Margin Requirement: If your broker offers 1:20 leverage, the total value of your position is $4,500 (4,500 points x $1/point). Your required margin would be $4,500 / 20 = $225.
Profit and Loss Calculation
Your profit or loss is determined by the difference between your entry and exit prices, multiplied by the value per point (or contract size).
Scenario 1: Index Rises (Profit)
Suppose the US 500 Index CFD rises to 4,550 points, and you decide to close your long position.
- Exit Price: 4,550 points.
- Price Difference: 4,550 – 4,500 = 50 points.
- Profit: 50 points x $10/point (10 contracts x $1/point) = $500.
In this scenario, with an initial margin of $225, you made a profit of $500, demonstrating the amplifying effect of leverage.
Scenario 2: Index Falls (Loss)
Now, imagine the US 500 Index CFD falls to 4,470 points, and you close your position to limit losses.
- Exit Price: 4,470 points.
- Price Difference: 4,500 – 4,470 = 30 points.
- Loss: 30 points x $10/point = $300.
Here, a relatively small price movement against your position resulted in a loss of $300, which is more than your initial margin. This highlights the significant risk associated with leveraged trading.
Spreads and Overnight Financing
When trading Index CFDs, two primary costs are typically involved:
- Spread: This is the difference between the buy (ask) and sell (bid) price of the CFD. It’s how brokers make money, and it’s essentially the cost of opening a trade. A tighter spread means lower transaction costs.
- Overnight Financing (Swap Fees): If you hold an Index CFD position open overnight, you may incur an overnight financing charge or credit. This reflects the cost of borrowing (or earning) the funds to maintain the leveraged position. These fees can accumulate, especially for long-term positions, and need to be factored into your trading strategy.
Differentiating Index CFDs: Cash vs. Futures
Cash CFDs vs. Futures CFDs
It’s important to understand that Index CFDs are typically offered in two main forms by brokers: Cash CFDs (also known as spot CFDs) and Index Futures CFDs. While both allow speculation on index price movements, they have distinct characteristics that influence trading strategies.
-
Cash CFDs (Spot CFDs): These CFDs are based on the underlying “cash” or “spot” price of the index. They are designed to reflect the real-time market price of the index, which is a continuous calculation of its constituent stocks. Cash CFDs typically feature tighter spreads, making them attractive for short-term, intraday trading. However, they are subject to overnight financing charges (swap fees) if positions are held open past the daily market close. This means that holding Cash CFD positions for several days or weeks can incur significant cumulative costs.
-
Index Futures CFDs: These CFDs are based on the price of an underlying index futures contract, which has a predetermined expiry date (e.g., quarterly). Unlike Cash CFDs, Futures CFDs often incorporate the cost of financing into their wider spread, meaning they generally do not incur separate overnight financing charges. This makes them more suitable for traders looking to hold positions for longer periods without the daily accumulation of swap fees. However, traders must be aware of the expiry date, as positions will either be automatically closed or rolled over to the next futures contract, potentially incurring a roll-over fee or a new spread. The pricing of Futures CFDs can also differ from the spot price due to factors like interest rates and dividends over the contract’s life.
Choosing between Cash and Futures CFDs depends on a trader’s strategy, time horizon, and sensitivity to financing costs versus spread. Short-term traders often prefer Cash CFDs for their tighter spreads, while longer-term position traders might opt for Futures CFDs to avoid daily swap fees.
Why Trade Index CFDs?
Index CFDs offer several compelling advantages that attract a wide range of traders and investors.
1. Broad Market Exposure
Trading an Index CFD provides immediate exposure to an entire economy or sector with a single position. Instead of researching and buying individual stocks, you can speculate on the collective performance of a group of companies. For example, a single trade on the Germany 40 CFD gives you exposure to 40 of Germany’s largest companies. This simplifies portfolio diversification and allows traders to react to macroeconomic news that affects broad markets rather than specific companies.
2. Profit from Both Rising and Falling Markets
Unlike traditional stock investing, where profits are typically realized only when prices rise, Index CFDs allow you to go both long (buy) and short (sell). This means you can potentially profit whether the market is in an uptrend or a downtrend, providing flexibility in various market conditions. If you anticipate an economic downturn, you can short an index and potentially profit from its decline.
3. Leverage Opportunities
As discussed, leverage enables traders to control larger positions with a smaller capital outlay. This can significantly amplify potential returns, making Index CFDs attractive to those seeking to maximize their capital efficiency. However, it’s a double-edged sword that also magnifies losses.
4. Hedging Existing Portfolios
Index CFDs are excellent tools for hedging. If you hold a portfolio of U.S. technology stocks, for instance, and anticipate a short-term market correction, you could open a short position on the US Tech 100 Index CFD. If the market falls, the profit from your short CFD position could offset some of the losses in your physical stock portfolio, acting as a form of portfolio insurance.
5. Access to Global Markets
Index CFDs offer convenient access to a vast array of global stock market indices, from the Dow Jones and S&P 500 in the U.S. to the FTSE 100 in the UK, the DAX 40 in Germany, and the Nikkei 225 in Japan. This allows traders to diversify their exposure across different geographies and economic cycles without the complexities of opening accounts in multiple international markets.
6. High Liquidity and Extended Trading Hours
Major Index CFDs typically exhibit high liquidity, meaning they can be bought and sold quickly without significant price impact. Many Index CFDs also offer extended trading hours, often allowing trading beyond the regular stock market hours of the underlying constituents. This provides more opportunities to react to global news and market events.
7. Correlation with Economic Health
Indices are often seen as direct indicators of economic health. A strong economy typically sees its major indices rise, while a struggling economy often sees them fall. This correlation allows traders to use fundamental economic analysis (GDP reports, inflation data, employment figures) to inform their trading decisions on Index CFDs.
Risks of Index CFD Trading
While offering numerous advantages, Index CFD trading carries significant risks that traders must fully understand and manage.
1. Leverage Magnifies Losses
The most prominent risk is that leverage amplifies losses just as it amplifies gains. A small adverse price movement can lead to substantial losses, potentially exceeding the initial margin deposited. In extreme cases, traders may be required to deposit additional funds (margin call) to maintain their positions.
2. Market Volatility
Indices can be highly volatile, especially during periods of economic uncertainty, major news announcements, or geopolitical events. Rapid and unpredictable price swings can lead to quick and substantial losses if positions are not managed effectively.
3. Overnight Financing Costs
Holding positions overnight incurs financing charges. These costs can accumulate over time, eating into potential profits or exacerbating losses, especially for longer-term trades.
4. Spreads and Slippage
The bid-ask spread is a transaction cost that must be overcome for a trade to become profitable. In volatile markets, spreads can widen, increasing the cost of trading. Additionally, “slippage” can occur, where an order is executed at a price different from the requested price, particularly during fast-moving markets or gaps.
5. Requires Advanced Knowledge and Risk Management
Successful Index CFD trading demands a deep understanding of market dynamics, technical and fundamental analysis, and disciplined risk management. Without these, traders are highly susceptible to significant losses.
6. Psychological Pressure
The rapid price movements and the potential for magnified gains or losses can create intense psychological pressure. Emotional decisions, such as chasing losses or overtrading, often lead to poor outcomes. Maintaining emotional discipline is crucial.
Popular Global Indices for CFD Trading
A wide array of global indices are available for CFD trading, each representing different economies and sectors. Some of the most frequently traded include:
U.S. Indices
- Dow Jones Industrial Average (DJIA / US 30): A price-weighted index of 30 large, publicly owned U.S. companies. It’s one of the oldest and most-watched indices, often seen as a bellwether for the broader U.S. economy.
- S&P 500 (US 500): A market-capitalization-weighted index of 500 of the largest U.S. publicly traded companies. It’s widely regarded as the best gauge of large-cap U.S. equities and the overall health of the U.S. stock market.
- Nasdaq 100 (US Tech 100): A market-capitalization-weighted index of 100 of the largest non-financial companies listed on the Nasdaq stock exchange. It is heavily weighted towards technology and growth companies, making it a key indicator for the tech sector.
- Russell 2000 (US Small Cap 2000): An index representing 2,000 small-capitalization U.S. companies. It is often used as a benchmark for the performance of smaller companies and the broader U.S. economy.
European Indices
- FTSE 100 (UK 100): A market-capitalization-weighted index of the 100 largest companies listed on the London Stock Exchange. It represents over 80% of the UK’s market capitalization.
- DAX 40 (Germany 40): A market-capitalization-weighted index of the 40 largest and most liquid German companies listed on the Frankfurt Stock Exchange. It’s a key indicator of the German economy.
- CAC 40 (France 40): A market-capitalization-weighted index of the 40 largest French companies listed on Euronext Paris.
- Euro Stoxx 50 (EU Stocks 50): A market-capitalization-weighted index representing 50 of the largest and most liquid blue-chip companies across the Eurozone.
Asian & Pacific Indices
- Nikkei 225 (Japan 225): A price-weighted index of 225 large-cap Japanese companies listed on the Tokyo Stock Exchange.
- Hang Seng Index (Hong Kong Index): A market-capitalization-weighted index of the largest and most liquid companies listed on the Hong Kong Stock Exchange.
- ASX 200 (Australia 200): A market-capitalization-weighted index of the 200 largest companies listed on the Australian Securities Exchange.
Successful Index CFD Trading Strategies
Effective Index CFD trading requires a well-defined strategy that integrates market analysis, disciplined risk management, and emotional control.
1. Develop a Robust Trading Plan
A trading plan is your roadmap. It should outline:
- Entry and Exit Strategies: Clear conditions for opening and closing trades.
- Risk Management Rules: Maximum loss per trade, overall portfolio risk, use of stop-loss orders.
- Position Sizing: How many contracts to trade based on your capital and risk tolerance.
- Trading Hours: Specific times you will trade.
- Indices to Trade: Focus on a few indices you understand well.
2. Market Analysis: Technical and Fundamental
- Technical Analysis: Involves studying historical price charts and patterns to predict future movements. Common tools include:
- Moving Averages: Identify trends and potential support/resistance levels.
- Relative Strength Index (RSI): Gauge overbought or oversold conditions.
- MACD (Moving Average Convergence Divergence): Signal trend changes.
- Support and Resistance Levels: Key price points where the index tends to pause or reverse.
- Fundamental Analysis: Focuses on economic indicators, news, and events that can influence index performance. Key factors include:
- GDP Growth: Strong economic growth often boosts corporate earnings and index values.
- Inflation Rates: Can impact central bank policy (interest rates), affecting market sentiment.
- Employment Data: Healthy job markets signal economic strength.
- Central Bank Announcements: Interest rate decisions and monetary policy statements significantly move markets.
- Geopolitical Events: Wars, trade disputes, or political instability can create volatility.
3. Implement Strict Risk Management
This is paramount for long-term success.
- Stop-Loss Orders: Automatically close a position if the price moves against you to a predetermined level, limiting potential losses.
- Take-Profit Orders: Automatically close a position when it reaches a predetermined profitable level, securing gains.
- Position Sizing: Never risk more than a small percentage (e.g., 1-2%) of your total trading capital on any single trade.
- Diversification: While indices offer broad exposure, diversifying across different indices or asset classes can further mitigate risk.
4. Emotional Discipline and Continuous Learning
The psychological aspect of trading is often underestimated. Fear, greed, and impatience can lead to irrational decisions. Stick to your trading plan, avoid impulsive actions, and accept that losses are a part of trading. Financial markets are constantly evolving, so continuous learning, adapting to new information, and refining your strategies are essential.
Beyond Macro: Granular Factors Driving Index Price Movements
Granular Factors Driving Index Price Movements
While macroeconomic indicators and central bank policies provide a broad framework for understanding index movements, several more granular factors also play a critical role, often causing significant short-term volatility and influencing long-term trends.
-
Company-Specific News for Heavily Weighted Constituents: Major indices are often dominated by a handful of large-cap companies. News related to these heavily weighted constituents can have a disproportionate impact on the entire index. For example, a disappointing earnings report from Apple or Microsoft could significantly drag down the S&P 500 or Nasdaq 100. Similarly, major mergers and acquisitions, product launches, or leadership changes within these influential companies can trigger substantial index movements.
-
Sectoral Performance and Trends: The performance of dominant sectors within an index is a key driver. For instance, the Nasdaq 100 is heavily weighted towards technology companies; therefore, news impacting the tech sector (e.g., regulatory changes, innovation breakthroughs, or shifts in consumer spending on tech) will profoundly affect the index. Similarly, financial sector performance is crucial for indices with significant banking or insurance components, while industrial news impacts manufacturing-heavy indices.
-
Commodity Price Fluctuations: For indices with a strong representation of resource-based companies, commodity prices are a vital factor. The FTSE 100, for example, includes major oil and mining companies. A significant rise in crude oil prices can boost the earnings and stock prices of energy giants, thereby lifting the entire FTSE 100. Conversely, a sharp decline in metal prices could negatively impact mining companies and, by extension, the index.
-
Intermarket Correlations and Global Capital Flows: Index prices are not isolated; they are influenced by broader intermarket dynamics. Rising bond yields, for instance, can make fixed-income investments more attractive relative to equities, potentially leading to capital outflows from stock markets and a decline in index values. Currency strength also plays a role, as a stronger domestic currency can make exports more expensive for multinational companies, impacting their earnings. Global capital flows, driven by investor sentiment and risk appetite, can shift rapidly between different asset classes and geographies, causing indices to rise or fall as money moves in or out of a particular market.
How to Start Trading CFDs on Indices
Embarking on Index CFD trading requires a structured approach to build confidence and competence.
1. Choose a Reputable Online Broker
Select a broker that is transparent about its regulatory status, offers competitive spreads, provides a robust trading platform, and has excellent customer support. Ensure they offer the specific Index CFDs you wish to trade.
2. Utilize a Demo Account
A demo account is an invaluable, risk-free learning environment. It allows you to:
- Familiarize yourself with the trading platform’s functionalities.
- Practice executing trades in real-time market conditions without risking actual capital.
- Test and refine your trading strategies.
- Understand how leverage, spreads, and overnight financing impact your trades.
- Gain insights into index price movements and market behavior.
Spend ample time on a demo account until you consistently demonstrate profitability and mastery of your chosen strategies.
3. Transition to a Live Trading Account
Once confident, you can open a live account. This typically involves:
- Completing a registration form with accurate personal information.
- Verifying your identity, typically through document submission (such as a government-issued photo ID and proof of address) and other due diligence measures.
- Funding your account using supported payment methods.
- Starting with a small amount of capital that you are comfortable losing.
- Strictly adhering to your risk management rules from day one.
Successful Index CFD trading is a journey of continuous learning, disciplined execution, and adapting to market dynamics. By combining thorough preparation with strategic insights, traders can harness the potential of Index CFDs to participate effectively in global financial markets.
Frequently Asked Questions
What is the primary difference between an Index CFD and an Index Fund?
An Index CFD is a derivative that allows speculation on an index’s price movements without owning the underlying assets, typically used for short-term trading with leverage. An Index Fund, conversely, is an investment vehicle that actually holds the stocks comprising an index, designed for long-term investment and portfolio diversification.
Can Index CFDs be used for long-term investment strategies?
While Index CFDs offer flexibility, they are generally better suited for short-to-medium term trading due to factors like overnight financing costs and the magnified risk associated with leverage. Long-term investment strategies typically favor direct ownership of assets or instruments like ETFs and index funds.
How do I manage the risk of leverage when trading Index CFDs?
Effective risk management for leveraged Index CFDs involves using stop-loss orders to limit potential losses, carefully sizing your positions to only risk a small percentage of your capital per trade, and avoiding over-leveraging. It’s crucial to understand that while Negative Balance Protection limits losses so your account balance does not fall below zero under normal trading conditions, leveraged trading carries significant risk, and you can lose your entire initial deposit.
What factors most influence Index CFD prices?
Index CFD prices are primarily influenced by the collective performance of their constituent companies, which in turn are affected by economic news (e.g., GDP, inflation, employment data), central bank policies, company financial results, and major geopolitical events. Trader sentiment also plays a significant role.
Is it possible to trade Index CFDs outside of normal market hours?
Many brokers offer extended trading hours for major Index CFDs, allowing traders to react to global news and events that occur outside the standard trading sessions of the underlying stock exchanges. However, liquidity might be lower during these extended hours, potentially leading to wider spreads.
Knowledge Check
1. Which of the following best describes the primary characteristic of an Index CFD?
- A) It grants direct ownership of all stocks within a specific market index.
- B) It allows traders to speculate on index price movements without owning the underlying assets.
- C) It is a long-term investment vehicle designed for passive portfolio growth.
- D) It is a physical commodity contract traded on futures exchanges.
2. What is a key risk associated with using leverage in Index CFD trading?
- A) It guarantees a minimum profit regardless of market direction.
- B) It limits potential losses to only the initial margin deposited.
- C) It can amplify both profits and losses, potentially exceeding the initial investment.
- D) It eliminates the need for market analysis and risk management.
3. Which of the following is a common method for calculating a stock market index, where larger companies have a greater impact on the index’s value?
- A) Equal weighting
- B) Price weighting
- C) Fundamental weighting
- D) Market capitalization-weighted
Click to view the answers
1. **B)** – An Index CFD is a derivative instrument that enables speculation on price movements without actual ownership of the underlying index components.
2. **C)** – Leverage is a double-edged sword that magnifies both potential gains and losses, meaning losses can exceed the initial margin.
3. **D)** – Market capitalization-weighted indices, like the S&P 500, give greater influence to companies with larger market values.