


Understanding how different currency pairs interact is a cornerstone of advanced CFD trading strategy. Currency correlation, a measure of the statistical relationship between two distinct currency pairs, provides critical insights for managing risk, diversifying portfolios, and identifying strategic trading opportunities. For traders operating in the dynamic forex market, recognizing these interdependencies can significantly refine decision-making.
Currency correlation measures the statistical relationship between the price movements of two distinct currency pairs. A positive correlation indicates pairs move in the same direction, while a negative correlation suggests they move inversely.
Understanding Currency Correlation
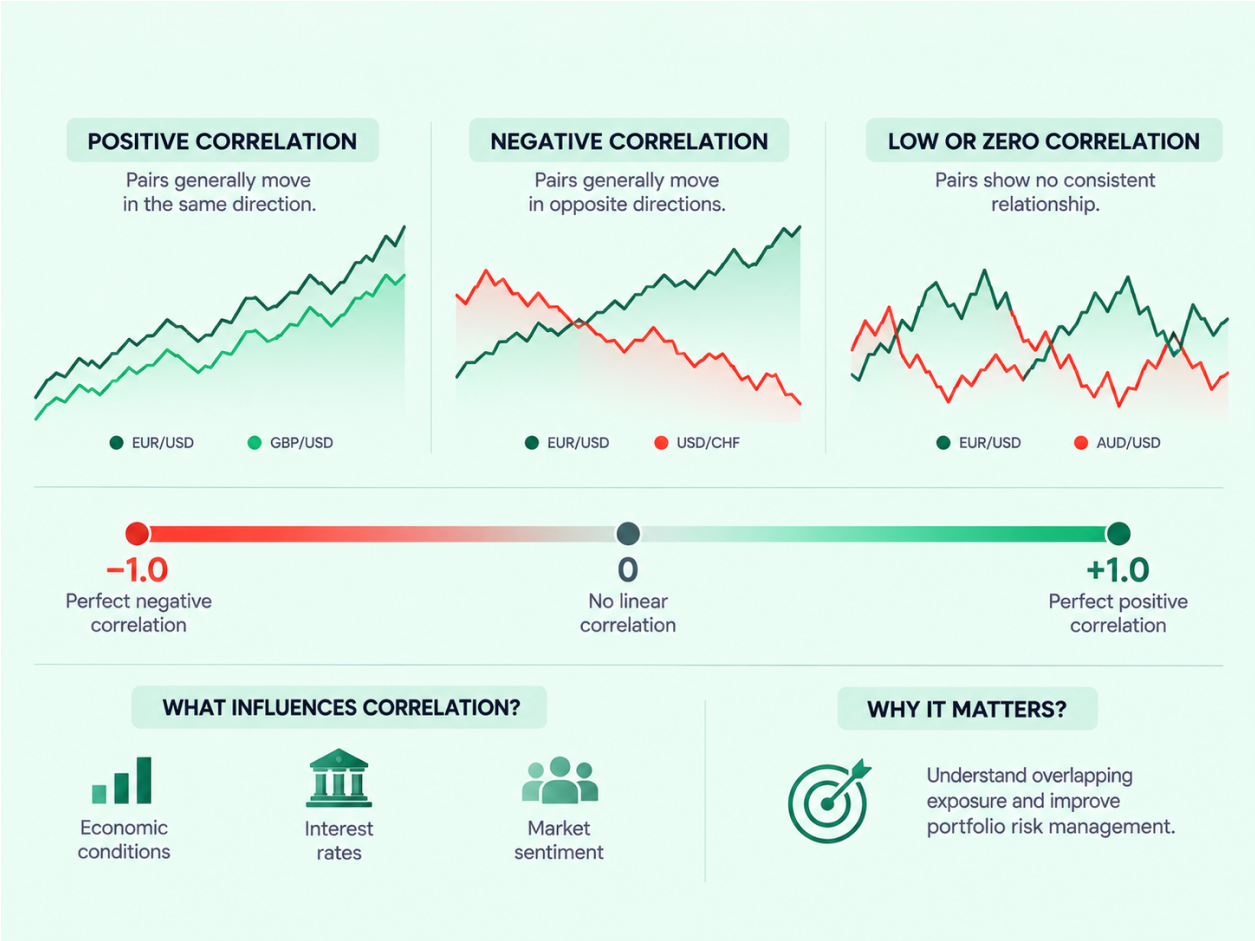
At its core, currency correlation describes the tendency of two currency pairs to move together, move in opposite directions, or show no consistent relationship. This phenomenon arises from the complex web of global economic, political, and financial factors that influence currency valuations.
- Positive Correlation: When two currency pairs exhibit a positive correlation, they tend to move in the same direction. For instance, if EUR/USD strengthens, a positively correlated pair like GBP/USD is likely to strengthen as well. Imagine two synchronized swimmers moving in perfect harmony; their movements mirror each other.
- Negative Correlation: Conversely, a negative correlation means two currency pairs typically move in opposite directions. If EUR/USD appreciates, a negatively correlated pair such as USD/CHF would tend to depreciate. This is akin to a tug-of-war, where one side gains ground as the other yields.
- Zero Correlation: A zero correlation suggests there is no discernible statistical relationship between the price movements of two currency pairs. Their movements are largely independent, like two unrelated individuals walking down different paths.
The Correlation Coefficient: Quantifying Relationships
To quantify the strength and direction of currency correlation, traders use a statistical measure called the correlation coefficient. This coefficient typically ranges from +1.0 to -1.0:
- +1.0 (Perfect Positive Correlation): Indicates that two currency pairs move in the exact same direction 100% of the time. If one rises by 1%, the other also rises by 1%.
- -1.0 (Perfect Negative Correlation): Signifies that two currency pairs move in precisely opposite directions 100% of the time. If one rises by 1%, the other falls by 1%.
- 0 (No Correlation): Suggests that there is no linear relationship between the price movements of the two pairs. Their movements are random relative to each other.
In practice, perfectly correlated pairs (+1.0 or -1.0) are rare. Most correlations exist somewhere between these extremes, with values closer to +1.0 or -1.0 indicating a stronger relationship, and values closer to 0 indicating a weaker one. The Pearson correlation coefficient is the most widely used measure in financial markets for this purpose.
Why Currencies Correlate: Underlying Drivers
Currency correlations are not arbitrary; they are driven by fundamental economic and market forces. Understanding these drivers helps traders anticipate potential shifts in correlation.
Economic Ties and Geographical Proximity
Currencies of countries with strong economic partnerships or geographical proximity often exhibit positive correlations. For example, the Eurozone and the United Kingdom share significant trade relationships, leading to a frequent positive correlation between EUR/USD and GBP/USD. Both currencies are often influenced by similar economic trends, monetary policy expectations from major central banks (like the Federal Reserve), and global risk sentiment.
Commodity Currencies
The currencies of commodity-exporting nations, often termed “commodity currencies,” frequently correlate with the prices of their primary exports.
- Canadian Dollar (CAD) and Crude Oil: Canada is a major oil producer. An increase in global crude oil prices typically boosts Canada’s export revenues, strengthening the Canadian dollar. This often manifests as a positive correlation between CAD-denominated pairs (e.g., CAD/JPY) and oil prices, or a negative correlation with USD/CAD, as oil is priced in USD.
- Australian Dollar (AUD) and Gold/Base Metals: Australia is a significant exporter of gold, iron ore, and other raw materials. When global demand for these commodities rises, the Australian dollar tends to strengthen, leading to a positive correlation between AUD/USD and commodity prices like gold.
Safe-Haven Status
Certain currencies and assets are considered “safe havens,” attracting investment during periods of global economic uncertainty or market volatility. The Japanese Yen (JPY) and gold are prominent examples. When risk aversion increases, investors often flock to these assets, leading to a positive correlation between JPY-denominated pairs (e.g., USD/JPY moving down) and gold prices (moving up). This inverse relationship with risk assets can create strong correlations.
Monetary Policy Divergence
Central bank actions and interest rate differentials are powerful drivers of currency movements. When the monetary policies of two countries diverge significantly (e.g., one central bank is aggressively hiking rates while another is holding steady), the correlation between their respective currencies can weaken or even reverse. Traders constantly monitor central bank announcements for clues on future rate paths, which can alter established correlations.
Global Market Sentiment
Broad shifts in global market sentiment, such as “risk-on” (investors seeking higher returns, often in riskier assets) or “risk-off” (investors seeking safety), can also influence correlations. During risk-off periods, safe-haven currencies tend to strengthen, while growth-sensitive currencies may weaken, creating temporary or sustained correlations across various pairs.
Implied Correlations in Cross-Currency Pairs
Beyond direct relationships, correlations can also be implied, particularly with cross-currency pairs. A cross-currency pair, such as GBP/JPY, does not directly involve the U.S. dollar. However, its movement and correlation are inherently linked to its constituent major currency pairs: GBP/USD and USD/JPY. Essentially, trading GBP/JPY is akin to trading a combination of these two major pairs.
This means that even if the USD is not explicitly in the GBP/JPY quote, significant movements in the USD (e.g., due to Federal Reserve policy or U.S. economic data) can indirectly influence GBP/JPY’s correlation dynamics. For instance, a strong USD rally might cause both GBP/USD to fall and USD/JPY to rise, thereby impacting the overall movement and correlation of GBP/JPY. Understanding these implied correlations provides a more sophisticated view of market interconnectedness.
Practical Applications of Currency Correlation in CFD Trading
Leveraging currency correlation can significantly enhance a CFD trader’s strategy, offering tools for risk management, diversification, and even magnifying profit potential.
1. Risk Management and Diversification
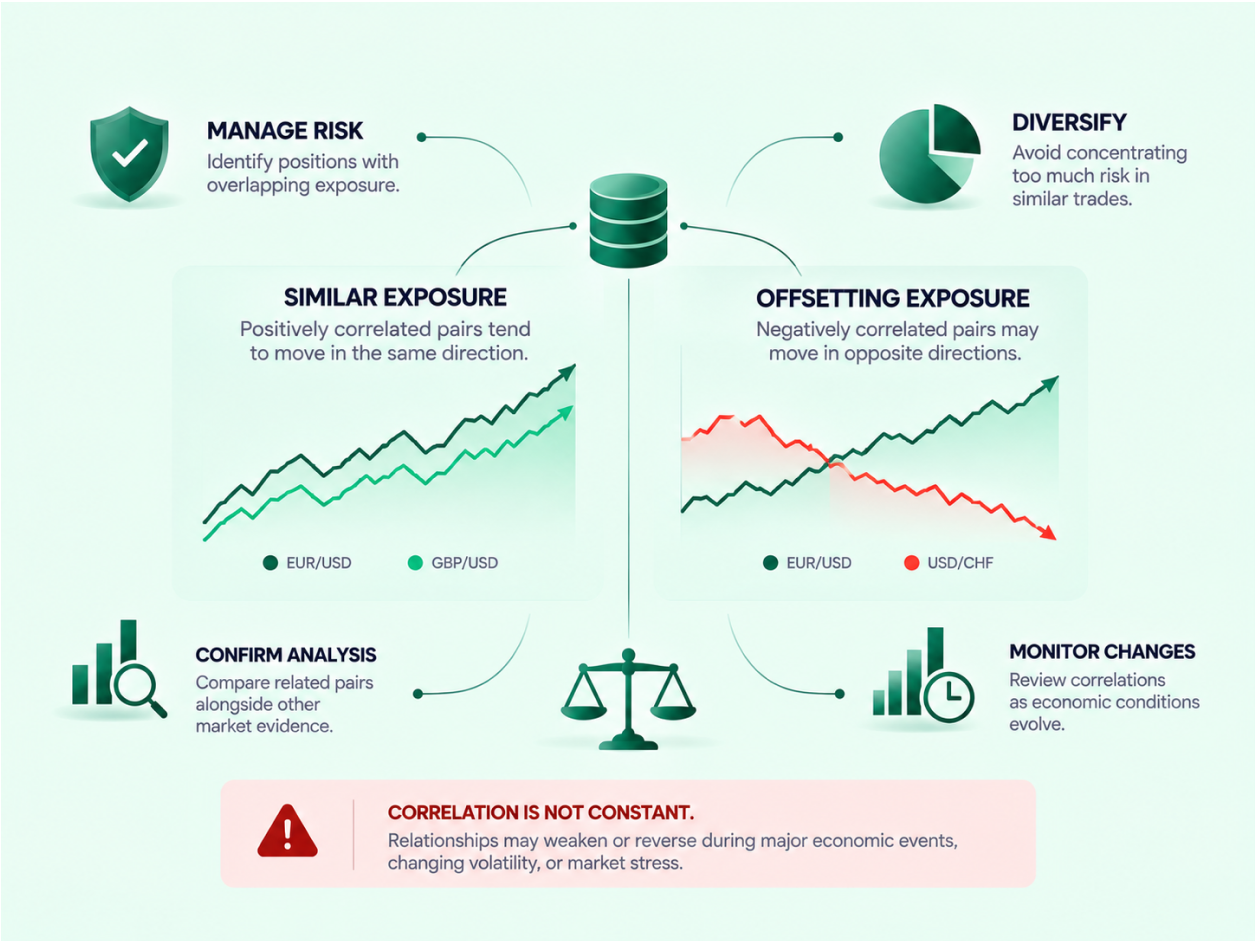
- Avoiding Redundant Exposure: If you open a long position on EUR/USD and then another long position on GBP/USD, given their strong positive correlation, you are essentially doubling your exposure to the same underlying market sentiment (e.g., USD weakness). While this can amplify gains if your forecast is correct, it also amplifies losses if the market moves against you. Recognizing this helps you avoid unintentional over-exposure.
- Preventing Self-Canceling Positions: Conversely, opening a long position on EUR/USD and simultaneously a long position on USD/CHF (which are often strongly negatively correlated) can effectively cancel out your market exposure. If EUR/USD rises, USD/CHF tends to fall, and your potential gains from one might be offset by losses in the other, leading to a near-neutral position. Understanding this helps prevent wasting capital and effort on conflicting trades.
- Strategic Diversification: For traders seeking to express a directional view while mitigating single-pair risk, imperfect correlations are invaluable. For example, if you are bearish on the USD but want to diversify beyond just one pair, instead of placing two large short positions on EUR/USD, you might consider one short EUR/USD and one short AUD/USD. While both pairs tend to move inversely to the USD, their correlation is not always perfect, meaning unique factors affecting the Eurozone or Australian economy could lead to slightly different performance, offering a degree of diversification.
2. Hedging Strategies
Currency correlation is a powerful tool for hedging existing positions, reducing potential losses from adverse market movements.
Example: Hedging a Long EUR/USD Position
Imagine you hold a long position on EUR/USD, anticipating a rise. However, you are concerned about potential short-term volatility or unexpected news that could cause a temporary dip. Knowing that EUR/USD and USD/CHF often exhibit a strong negative correlation, you could implement a hedge:
- Primary Position: You are long 1 standard lot (100,000 units) of EUR/USD. Each pip movement is approximately $10.
- Hedging Position: You open a long position on 0.8 standard lots (80,000 units) of USD/CHF. Each pip movement for this size is approximately $7.39 (assuming a pip value of ~$9.24 per 100,000 units).
Let’s say EUR/USD unexpectedly falls by 20 pips. Your loss on the primary position would be 20 pips * $10/pip = -$200. Due to the strong negative correlation, USD/CHF is likely to rise by a similar amount, say 18 pips. Your gain on the hedging position would be 18 pips * $7.39/pip = +$133.02.
Without the hedge, your loss would be -$200. With the hedge, your net loss is reduced to -$200 + $133.02 = -$66.98. While the hedge reduces your potential profit if EUR/USD rises, it significantly dampens losses during adverse movements, providing a crucial layer of risk protection.
3. Confirming Trading Signals
Correlations can act as a secondary confirmation for trading signals. If you identify a bullish technical pattern on EUR/USD, checking a positively correlated pair like GBP/USD for a similar pattern can reinforce your conviction. Conversely, if a negatively correlated pair like USD/CHF shows a bearish pattern, it further supports your bullish view on EUR/USD. This cross-market analysis adds depth to your technical and fundamental assessments.
4. Identifying Breakdowns in Correlation
Sudden, significant deviations from established correlations can signal important market shifts or emerging opportunities. For example, if EUR/USD and GBP/USD, which are typically highly correlated, suddenly move in opposite directions, it could indicate a major fundamental divergence between the Eurozone and UK economies (e.g., unexpected central bank policy shifts, significant economic data releases). Such breakdowns can present unique trading opportunities for those who identify them early.
The Dynamic Nature of Correlation: What Traders Must Know
It is crucial for CFD traders to understand that currency correlations are not static. They are highly dynamic and can change over short periods (daily, weekly) as well as longer terms (monthly, quarterly). Factors that cause these shifts include:
- Economic Data Releases: Unexpected inflation figures, employment reports, or GDP growth can instantly alter the perceived strength of an economy and, consequently, its currency’s correlation with others.
- Central Bank Policy Changes: Shifts in interest rate expectations or quantitative easing/tightening policies are potent correlation disruptors.
- Geopolitical Events: Wars, trade disputes, or political instability can trigger immediate shifts in risk sentiment, affecting safe-haven flows and commodity prices, thereby altering correlations.
- Market Liquidity and Trading Volumes: During periods of low liquidity, correlations can become more erratic.
Therefore, relying on outdated correlation data can lead to suboptimal or even detrimental trading decisions. Professional traders regularly monitor correlation matrices provided by their trading platforms or calculate them using spreadsheet software to stay current with market dynamics. While daily updates might be excessive for some, reviewing correlations every few weeks or at least monthly is a prudent practice.
Calculating Currency Correlation (Simplified Approach)
While complex statistical software can perform sophisticated correlation analysis, most CFD traders can gain valuable insights using readily available tools. Many trading platforms offer built-in correlation matrices or indicators. For more customized analysis, spreadsheet programs like Microsoft Excel provide a simple function:
- Gather Price Data: Download historical daily closing prices for the two currency pairs you wish to analyze (e.g., EUR/USD and USD/CHF) from your trading platform or a financial data provider.
- Organize Data: Place the price data for each currency pair into separate columns in your spreadsheet. Ensure the dates align.
- Use the
CORRELFunction: In an empty cell, type=CORREL(array1, array2).array1: Select the range of cells containing the price data for the first currency pair.array2: Select the range of cells containing the price data for the second currency pair.- For example:
=CORREL(A2:A250, B2:B250)for a year’s worth of daily data.
- Interpret the Result: The number generated will be the correlation coefficient for the specified period. Repeat this process for different timeframes (e.g., 1 month, 3 months, 6 months, 1 year) to observe how correlations evolve.
Key Takeaways for CFD Traders
Currency correlation is an indispensable concept for any serious CFD trader. It moves beyond simply analyzing individual currency pairs, offering a holistic view of market interdependencies. By understanding positive, negative, and shifting correlations, traders can:
- Optimize Risk Management: Avoid unintended over-exposure or self-canceling positions.
- Enhance Diversification: Spread risk across related assets while maintaining a directional bias.
- Implement Effective Hedging: Protect existing positions from adverse market movements.
- Validate Trading Signals: Gain higher conviction by cross-referencing correlated pairs.
- Identify Market Shifts: Recognize when established relationships break down, signaling new opportunities or risks.
Regularly monitoring and adapting to the dynamic nature of currency correlations is paramount. Integrating this quantitative approach into your trading strategy can lead to more robust portfolio management and more informed trading decisions in the complex world of CFD trading.
Frequently Asked Questions
What is the primary benefit of understanding currency correlation for CFD traders?
The primary benefit is enhanced risk management and strategic diversification. Traders can avoid unintentionally doubling up on risk or creating self-canceling positions, while also using correlations to hedge existing trades and spread exposure more effectively.
How does a strong positive correlation impact a trader’s portfolio if they hold long positions in both correlated pairs?
A strong positive correlation means both pairs tend to move in the same direction. If a trader holds long positions in both, their profit or loss potential is amplified, as both positions would likely gain or lose simultaneously.
Why do currency correlations change over time?
Currency correlations are dynamic due to evolving economic data, shifts in central bank monetary policies, geopolitical events, and changes in global market sentiment. These factors constantly influence the relative strength and relationships between currencies.
Can currency correlation be used to predict future price movements?
While correlation indicates the historical tendency of pairs to move together or apart, it is not a direct predictor of future price movements. It is a statistical measure of relationship, best used as a risk management tool and for confirming existing trade ideas, rather than a standalone forecasting method.
Knowledge Check
1. What does a correlation coefficient of -0.95 between two currency pairs signify?
- A) The pairs have a weak positive correlation.
- B) The pairs tend to move in the same direction almost perfectly.
- C) The pairs have a strong tendency to move in opposite directions.
- D) There is no discernible relationship between the pairs.
2. Which of the following is a key reason why the Canadian Dollar (CAD) often shows a positive correlation with crude oil prices?
- A) Canada is a major importer of crude oil, benefiting from lower prices.
- B) Crude oil is primarily traded in CAD, increasing its demand.
- C) Canada is a significant exporter of crude oil, so higher oil prices boost its economy and currency.
- D) The Bank of Canada frequently intervenes in oil markets.
3. A CFD trader holds a long position on EUR/USD. To hedge against potential short-term declines, they decide to open a position on a negatively correlated pair. Which action would be most appropriate?
- A) Open another long position on GBP/USD.
- B) Open a short position on USD/JPY.
- C) Open a long position on USD/CHF.
- D) Open a short position on AUD/USD.
Click to view the answers
1. **C)** – A correlation coefficient close to -1.0, like -0.95, indicates a very strong negative correlation, meaning the pairs tend to move in opposite directions.
2. **C)** – As a major crude oil exporter, Canada’s economy benefits from rising oil prices, which typically strengthens the Canadian Dollar.
3. **C)** – EUR/USD and USD/CHF typically have a strong negative correlation, so a long position on USD/CHF would act as a hedge, potentially gaining value if EUR/USD declines.