

The hammer candlestick is one of the most recognisable patterns in technical analysis. It has a small body near the top of the candle, a long lower wick and little or no upper wick.
Its shape tells a simple story: sellers pushed price significantly lower, but buyers subsequently recovered much of the decline before the candle closed.
When a hammer appears after a downtrend, traders may interpret that rejection of lower prices as an early sign that selling pressure is weakening.
However, spotting the shape is only part of the analysis.
A hammer does not guarantee a bullish reversal, its colour is less important than many beginners assume, and the frequently searched term “bearish hammer” can refer to different patterns depending on who is using it.
In this beginner’s guide, we’ll explain what a hammer candlestick is, what green and red hammers mean, why “bearish hammer” causes confusion and what historical testing tells us about the pattern’s reliability.
What Is a Hammer Candlestick?
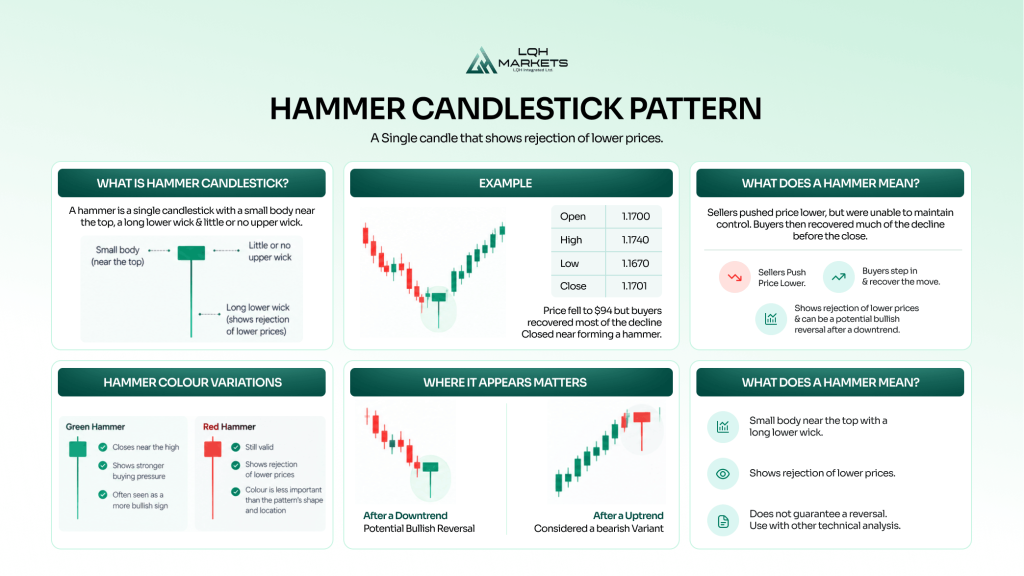
A hammer is a single candlestick pattern characterised by:
- a small real body near the top of the candle
- a long lower wick
- little or no upper wick
- a lower wick typically at least twice the size of the body
The pattern gets its name from its appearance. The body resembles the head of a hammer while the long lower wick looks like its handle.
However, the location of the candle matters as much as its shape.
A conventional hammer occurs following declining prices and is treated as a potential bullish reversal pattern.
Thomas Bulkowski’s Encyclopedia of Candlestick Charts definition of the hammer similarly describes it as a single candle appearing within a downward price trend, with a small body and long lower shadow.
This distinction becomes important later because exactly the same shape appearing after an uptrend has a different name and interpretation.
What Does a Hammer Candlestick Mean?
The easiest way to understand a hammer is to forget its name temporarily and examine what happened to price inside the candle.
Imagine an asset opens at $100.
Sellers take control:
$100 → $98 → $96 → $94
Price has fallen 6% from its opening level.
Buyers then enter strongly enough to recover most of the decline:
$94 → $96 → $98 → $99.50
The candle eventually closes at $99.50.
Price is still slightly below its opening level, but the journey between the open and close contains considerably more information.
Sellers successfully pushed the market from $100 to $94.
They could not maintain those lower prices.
Buyers subsequently recovered almost the entire decline.
The resulting candlestick would have:
| Price | Example |
| Open | $100.00 |
| High | $100.10 |
| Low | $94.00 |
| Close | $99.50 |
That creates the hammer’s distinctive long lower wick.
The important information is therefore not simply that a hammer appeared.
It is that lower prices were rejected during that particular period.
How to Identify a Hammer Candlestick
Beginners can look for four main characteristics.
1. A Small Real Body
The difference between the opening and closing prices should be relatively small compared with the candle’s total range.
The body sits towards the upper end of the candle.
2. A Long Lower Wick
The lower wick is the defining characteristic of the hammer.
A common textbook guideline is that the lower wick should be at least twice the length of the real body.
This tells you price travelled substantially below its opening and closing area before recovering.
3. Little or No Upper Wick
A textbook hammer has little price movement above the body.
A small upper wick does not necessarily prevent a candle from being hammer-like, but a substantial upper wick begins to change the structure of the pattern.
4. It Appears After Falling Prices
This is particularly important.
A hammer is conventionally a potential bullish reversal pattern following a decline.
If the same candle appears after an established uptrend, it is generally called a hanging man, not a hammer.
That is why traders should identify the trend before naming the candlestick.
Our guide to understanding market structure through higher highs and lower lows explains how price structure can be used to establish whether a market is trending up, trending down or ranging.
Does a Hammer Candlestick Have to Be Green?
No.
A hammer can be either green or red, depending on whether the closing price finished above or below the opening price.
Green Hammer
A green hammer occurs when:
Close > Open
Sellers pushed price lower, buyers recovered the decline and the market eventually closed above its opening price.
Red Hammer
A red hammer occurs when:
Close < Open
Sellers again pushed price substantially lower and buyers recovered much of the decline, but price still finished slightly below where it opened.
Both candles contain the hammer’s defining feature: a significant rejection of lower prices.
A green body may appear visually stronger because buyers recovered enough ground to close above the opening price. However, candle colour alone does not establish that the market will subsequently reverse.
Trend, location and subsequent price action remain important.
What Is a Bearish Hammer Candlestick?
This is where candlestick terminology becomes confusing.
“Bearish hammer” is a genuine search term, but it does not have one universally consistent meaning across trading websites.
Sometimes traders use bearish hammer simply to describe a hammer with a red or bearish-coloured body.
Under that definition, a bearish hammer can still occur after a downtrend and still represent rejection of lower prices. The word “bearish” describes the candle’s close relative to its open, not necessarily the expected direction of the next move.
However, the term is also sometimes used for a hammer-shaped candle appearing after an uptrend.
In standard candlestick terminology, that pattern is usually called a hanging man.
For example, Colibri Trader’s explanation of the bearish hammer explicitly notes this naming problem: traders sometimes call the hammer-shaped candle at the top of an advance a bearish hammer, while the conventional name is hanging man.
Other sources use the terminology differently again, which is why searching for “bearish hammer” can produce conflicting diagrams and explanations.
For beginners, it is clearer to separate colour, shape and location:
| Candle | Location | Shape | Typical Interpretation |
| Green hammer | After decline | Long lower wick | Potential bullish reversal |
| Red hammer | After decline | Long lower wick | Potential bullish reversal |
| Hanging man | After rise | Long lower wick | Potential bearish reversal warning |
| Inverted hammer | After decline | Long upper wick | Potential bullish reversal |
This prevents a common mistake:
A red hammer is not automatically a bearish reversal pattern.
The context in which the candle appears matters more than simply whether its body is red or green.
Hammer vs Hanging Man
The hammer and hanging man demonstrate perfectly why candlestick shapes should never be interpreted without context.
Visually, they can be identical.
Both have:
- a small body
- a long lower wick
- little or no upper wick
The difference is what happened before the candle formed.
Hammer
A hammer appears after declining prices.
Sellers extend the decline during the candle, but buyers recover much of the move.
That can suggest selling pressure is weakening.
Hanging Man
A hanging man appears after rising prices.
The long lower wick shows that sellers were capable of pushing price substantially lower during the period, even though price later recovered.
Traders may therefore treat it as a warning that the previous upward move is becoming less secure.
The candle itself still does not confirm a reversal.
Subsequent price action is required to determine whether sellers actually gain control.
Hammer vs Dragonfly Doji
A hammer can also look very similar to a dragonfly doji.
Both have:
- a long lower wick
- little or no upper wick
- price concentrated around the top of the candle
The key difference is the body.
A dragonfly doji has an opening and closing price that are virtually identical, so it has almost no real body.
A hammer has a small but visible body.
| Feature | Hammer | Dragonfly Doji |
| Lower wick | Long | Long |
| Upper wick | Little or none | Little or none |
| Body | Small but visible | Virtually none |
| Open and close | Different | Almost identical |
| Common context | After decline | Often watched after decline |
The distinction may look minor, but it reflects a different relationship between the opening and closing prices.
For more detail, see our Dragonfly Doji: A Beginner’s Guide to the Candlestick Pattern.
Hammer vs Inverted Hammer
Despite their similar names, the two patterns point in opposite directions visually.
A standard hammer has its long wick below the body.
An inverted hammer has its long wick above the body.
Both are typically discussed in the context of falling prices and potential bullish reversals, but the price action inside each candle is different.
With a hammer, sellers pushed price lower before buyers recovered.
With an inverted hammer, buyers managed to push price substantially higher during the period but could not maintain the full move into the close.
This is another reason to analyse what the wick actually represents rather than simply memorising candlestick names.
How Beginners Can Analyse a Hammer Step by Step
Finding a hammer on a chart is easy.
Deciding whether it is meaningful requires more work.
Step 1: Establish the Existing Trend
Look at the price action preceding the hammer.
Has price been creating lower highs and lower lows?
If so, there is an established decline for the hammer potentially to reverse.
If price is already trending strongly higher, the candle is more appropriately considered in hanging-man context.
Step 2: Look at Where the Hammer Formed
Location can provide additional context.
Ask whether the hammer has formed:
- around a previous swing low
- near an established support area
- after an extended decline
- in the middle of an unclear sideways range
A hammer at a meaningful price level tells you that lower prices were rejected at an area the market has previously responded to.
A random hammer in choppy price action provides less context.
Step 3: Examine the Wick
The lower wick should be prominent relative to the body.
Instead of simply checking whether it is “long”, think about what it represents.
Price moved significantly lower.
Something then changed.
Buyers were willing to transact at increasingly higher prices until much of the decline had been recovered.
Step 4: Wait for the Candle to Close
A hammer does not exist until the candle is complete.
A one-hour candle could look like a perfect hammer after 50 minutes and then fall sharply during the final ten minutes.
The completed candle may look completely different.
Step 5: Watch What Happens Next
A hammer tells you buyers recovered from the candle’s low.
It does not prove that buyers will remain in control.
Suppose the following candle moves above the hammer’s high and closes strongly higher.
That provides additional evidence that buying continued beyond the original rejection.
Now imagine instead that the next candle falls through the hammer’s low.
The attempted rejection has failed almost immediately.
These outcomes contain more information than the hammer alone.
How Reliable Is a Hammer Candlestick?
The hammer is commonly described as a bullish reversal pattern.
Historical testing suggests the reality is more nuanced.
Thomas Bulkowski’s historical testing of the hammer candlestick, based on the research behind Encyclopedia of Candlestick Charts, found that the hammer acted as a bullish reversal approximately 60% of the time.
That sounds reasonably strong until another statistic is considered.
After the breakout, the hammer’s overall performance ranked only 65th out of 103 candlestick patterns tested.
In other words, the pattern correctly preceded a reversal more often than chance in that dataset, but the price movement that followed was relatively unremarkable compared with many other candlestick patterns.
Bulkowski’s testing also found an interesting difference based on where the hammer appeared within its longer-term price range: hammers occurring within the lower third of the yearly price range produced the best performance following upward breakouts.
The Wiley chapter covering Bulkowski’s hammer research also reports that the strongest performance occurred when hammers appeared during bear markets, regardless of eventual breakout direction.
These findings need to be interpreted carefully.
The research is historical and predominantly based on stocks. It does not mean that a hammer appearing on EUR/USD, gold, Bitcoin or an equity index has a universal 60% probability of reversing.
Nor does it establish that every hammer appearing near a yearly low will produce a profitable trade.
Instead, the findings highlight something useful:
the same candlestick shape can behave differently depending on the market conditions surrounding it.
That supports analysing the hammer as part of a wider setup rather than treating the shape itself as a complete trading strategy.
Why a 60% Reversal Rate Doesn’t Mean a 60% Profitable Strategy
This distinction is particularly important for beginners.
Suppose a pattern predicts direction correctly 60% of the time.
That does not automatically create a profitable trading strategy.
Imagine ten hypothetical trades:
- six win £50 each = +£300
- four lose £100 each = -£400
The strategy correctly predicted direction 60% of the time but still lost £100.
Alternatively:
- four trades win £150 each = +£600
- six lose £50 each = -£300
The second strategy wins only 40% of the time but produces a £300 gain.
This is why win rate should never be considered without:
- average winning trade
- average losing trade
- transaction costs
- spread
- risk per trade
- position sizing
The hammer’s historical reversal percentage is therefore interesting evidence about the pattern, but it should not be interpreted as a guaranteed success rate.
Using RSI With a Hammer Candlestick
A momentum indicator such as RSI can provide a different type of information.
Imagine price has been falling and eventually forms a hammer around a previous low.
At the same time:
Price: makes a lower low.
RSI: makes a higher low.
This creates bullish RSI divergence.
The hammer and RSI are now describing two different features of the market.
The hammer shows that lower prices were rejected during the latest candle.
RSI divergence shows that momentum did not confirm the latest lower price extreme.
Neither guarantees that the market will reverse.
But using different analytical tools to answer different questions can provide more context than repeatedly looking for signals that measure the same thing.
Our guide to identifying bullish and bearish RSI divergence explains how price and momentum can diverge in more detail.
Hammer Candlesticks and Market Structure
Market structure can also help traders distinguish between a temporary bounce and evidence of a wider reversal.
Imagine price is producing:
Lower high → lower low → lower high → lower low
A hammer appears at the latest low.
The hammer tells you that lower prices were rejected during that candle.
But the broader market is still structurally bearish.
If price subsequently rallies but fails below the previous lower high, the downtrend may remain intact.
If price eventually breaks above an important previous swing high, there is stronger evidence that the structure itself is changing.
This distinction can stop beginners from assuming that one bullish-looking candle automatically ends an established trend.
Where Could a Stop Loss Be Placed Around a Hammer?
When traders use a confirmed hammer as part of a long setup, the low of the wick provides an obvious technical reference point.
The reasoning is straightforward.
The original interpretation of the hammer is that sellers pushed price to the low but buyers rejected those prices.
If price subsequently trades decisively below the hammer low, that rejection has failed to hold.
However, automatically placing a stop exactly beneath every hammer is not a complete risk-management strategy.
Spread, volatility, surrounding market structure and position size all need to be considered.
Our guide to setting stop loss and take profit orders in MT5 explains how protective orders work, while our article on why stop losses get hit explores how volatility and market structure can affect stop placement.
Common Hammer Candlestick Mistakes
Assuming a Hammer Guarantees a Reversal
Historical testing itself shows this isn’t the case.
A hammer is evidence that lower prices were rejected during one candle, not proof that an entire downtrend has finished.
Calling Every Long-Lower-Wick Candle a Hammer
Context matters.
After a decline, the pattern may be a hammer.
After an advance, the same shape is normally called a hanging man.
Assuming a Red Hammer Is Bearish
A red body simply means the close finished below the open.
The long lower wick still shows a recovery from substantially lower prices.
Ignoring the Existing Trend
A reversal signal needs something to reverse.
Without understanding the preceding price structure, the pattern loses much of its context.
Entering Before the Candle Closes
Candlestick shapes change until their timeframe finishes.
Wait for the completed candle before classifying the pattern.
Focusing Only on Win Rate
A 60% historical reversal rate does not mean 60% of trades will be profitable.
Risk and reward determine whether a strategy makes or loses money.
How Beginners Can Practise Hammer Candlestick Analysis
Beginners can learn considerably more from studying historical examples than memorising diagrams.
Choose one market and timeframe.
Find 20 or 30 hammer-shaped candles and record:
- whether price was actually in a downtrend
- whether the candle was green or red
- the lower wick-to-body relationship
- where it appeared within the wider price structure
- whether it formed near a previous swing low
- what the next candle did
- whether price broke the hammer high or low first
- where price was five or ten candles later
Then compare the results. You may find that some textbook-perfect hammers fail immediately while less visually perfect examples precede larger moves.
That is precisely the point of the exercise.
Candlestick analysis is about understanding price behaviour and context, not simply collecting perfect shapes.
Trading Hammer Candlestick Patterns With LQH Markets
Hammer candlesticks can appear across forex, indices, commodities, stocks and cryptocurrency markets.
With LQH Markets, traders can use MetaTrader 5 to identify hammer patterns across multiple chart timeframes and combine candlestick analysis with tools such as RSI and broader market structure.
Rather than treating every hammer as an automatic buy signal, traders can observe whether lower prices have been rejected, where the candle appears within the existing trend and whether subsequent price action confirms the initial recovery.
Beginners can practise identifying these setups with virtual funds before deciding whether to trade live.
Ready to get started? Open a live LQH Markets account or start with a demo account.
Risk disclaimer
CFDs are complex instruments with a high risk of losing all your invested capital. Only trade with money you can afford to lose. Content is for general information only and is not investment advice.
Final Thoughts
The hammer candlestick is a simple pattern with a more nuanced meaning than its appearance suggests.
Its long lower wick shows that sellers successfully pushed price down before buyers recovered much of the decline.
Following a downtrend, that rejection can provide early evidence that selling pressure is weakening.
But three points are particularly important for beginners.
First, location determines the pattern. The same shape following an uptrend is normally a hanging man rather than a hammer.
Second, a red hammer is not automatically bearish. Candle colour describes the relationship between the open and close, while the wick and surrounding trend provide the wider context.
Third, historical testing does not support treating every hammer as a high-probability reversal. Bulkowski’s testing found a bullish reversal approximately 60% of the time, but the pattern ranked only 65th of 103 for subsequent performance.
The more useful question is therefore not:
“Is this hammer bullish or bearish?”
It is:
“What was price doing before the hammer, where did it form, what does its wick tell me, and what does price do afterwards?”
That turns a simple candlestick shape into useful price-action analysis.
Hammer Candlestick FAQs
What is a hammer candlestick?
A hammer is a single candlestick with a small body near the top of its range, a long lower wick and little or no upper wick. When it forms after falling prices, traders may interpret the rejection of lower prices as a potential early sign of a bullish reversal.
Is a hammer candlestick bullish or bearish?
A conventional hammer is considered a potential bullish reversal pattern because it appears after a decline. However, the pattern does not guarantee a reversal. The same hammer-shaped candle appearing after an uptrend is normally called a hanging man and can have bearish reversal implications.
What is a bearish hammer candlestick?
“Bearish hammer” is used inconsistently. It can refer to a red hammer, where price closes slightly below its opening level, or to a hammer-shaped candle appearing after an uptrend. The latter is more conventionally called a hanging man. Traders should therefore look at the candle’s shape, colour and trend context rather than relying on the phrase “bearish hammer” alone.
Does a red hammer mean price will fall?
No. A red hammer simply means its closing price was below its opening price. If it forms after a decline, its long lower wick still shows that buyers recovered significantly from the candle’s low. Subsequent price action is needed to determine whether that rejection develops into a wider reversal.
How reliable is a hammer candlestick?
Historical testing published by Thomas Bulkowski found that the hammer acted as a bullish reversal around 60% of the time. However, its overall post-breakout performance ranked only 65th among 103 candlestick patterns tested. These historical results are market- and methodology-specific and should not be treated as a universal probability for every hammer or asset.