

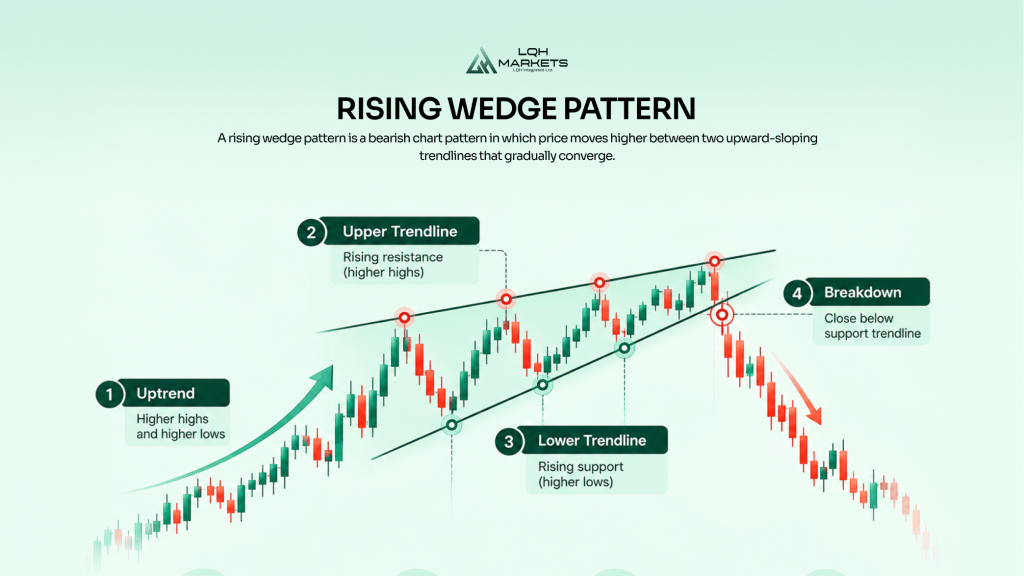
A rising wedge pattern is a bearish chart pattern in which price moves higher between two upward-sloping trendlines that gradually converge. It can signal a potential reversal when it forms during an uptrend, or bearish continuation when it develops as a temporary rally within a broader downtrend.
However, the rising shape alone does not confirm that prices will fall. A rising wedge is generally considered confirmed only when price breaks below its lower support trendline. Even then, chart patterns are probabilistic rather than guaranteed signals.
In this guide, we explain how to identify a rising wedge, what it can tell you about market momentum, how traders use it to plan entries and exits, and what historical pattern data tells us about its reliability.
What Is a Rising Wedge Pattern?
A rising wedge is a technical analysis pattern created when price forms a series of higher highs and higher lows within a narrowing trading range.
Two trendlines can be drawn around this price action:
- An upper resistance line connecting the rising swing highs
- A lower support line connecting the rising swing lows
Both lines slope upwards, but the lower support line typically rises more steeply than the resistance line. This causes the two lines to converge.
The result is an upward-pointing wedge.
Despite price continuing to rise inside the formation, the contracting range can indicate that bullish momentum is weakening. Each new push higher is making less progress than earlier moves.
This is why the rising wedge is generally interpreted as a bearish chart pattern.
What Does a Rising Wedge Look Like?
A typical rising wedge has four important characteristics:
| Feature | Rising wedge characteristic |
| Price direction | Moves progressively higher |
| Swing structure | Higher highs and higher lows |
| Trendlines | Both slope upwards |
| Range | Narrows as the trendlines converge |
| Typical implication | Bearish |
| Confirmation | Break below lower trendline |
| Volume | Often decreases as the wedge develops |
The important detail is the convergence.
A market simply moving upwards between two parallel lines would resemble an ascending channel rather than a wedge. In a rising wedge, the distance between support and resistance becomes progressively smaller.
This creates an interesting conflict in the chart.
Price is still technically rising, but its ability to move higher is weakening.
Traders who understand market structure will recognise why this distinction matters. Higher highs and higher lows normally characterise bullish structure, but the contracting swings of a rising wedge suggest that the strength behind that structure may be deteriorating.
Why Is a Rising Wedge Bearish?
The easiest way to understand a rising wedge is to look beyond its shape and consider what buyers and sellers are doing.
Imagine price initially rises from $100 to $110.
It pulls back to $105 before buyers push it to $114.
The next pullback stops at $110, but the following rally only reaches $116.
Price is still making higher highs and higher lows, but each upward move is becoming smaller.
Buyers are still capable of pushing the market higher, but they are achieving progressively less.
Eventually, if price breaks below the rising support line, the sequence changes. Buyers who previously defended each higher low are no longer maintaining the structure.
That breakdown is more meaningful than the wedge shape itself.
This distinction is important because a rising wedge should generally be treated as a potential bearish setup until price confirms it, rather than evidence that the market must reverse.
Rising Wedge Reversal vs Continuation Pattern
One useful characteristic of a rising wedge is that it can appear in two different market environments.
Rising wedge reversal
When a rising wedge develops after an established uptrend, it can indicate a potential bearish reversal.
Price has already been trending higher before entering an increasingly compressed upward move.
If the lower trendline subsequently breaks, the wedge may mark the transition from bullish to bearish market structure.
Rising wedge continuation
A rising wedge can also develop during an existing downtrend.
In this scenario, price temporarily moves upwards against the broader bearish trend. Instead of developing into a new sustained uptrend, however, the rally gradually loses momentum and contracts.
A break below the wedge can then indicate that the original downtrend is resuming.
This makes the rising wedge unusual because its context can change while its directional implication remains broadly the same:
Uptrend + rising wedge = potential bearish reversal
Downtrend + rising wedge = potential bearish continuation
The pattern therefore becomes much more useful when analysed alongside the broader trend rather than viewed in isolation.
How to Identify a Rising Wedge
Finding two upward-sloping lines on a chart is not enough to establish a strong rising wedge.
Traders can look for several characteristics.
1. Higher highs and higher lows
Price should generally move upwards throughout the formation.
Each major swing high exceeds the previous high, while each major swing low remains above the previous low.
2. Converging trendlines
Draw one trendline through the swing highs and another through the swing lows.
Both should rise, but they should move closer together.
Thomas Bulkowski’s research into more than 1,400 rising wedge formations suggests that a well-defined wedge should contain at least five touches across the two boundaries – typically three touches of one trendline and two of the other.
That is a useful distinction between an established pattern and two arbitrarily drawn lines.
3. Contracting price action
The vertical distance between highs and lows should decrease.
This compression is central to the pattern.
Without it, the formation may simply be an ascending channel.
4. Weakening momentum
A rising wedge can develop while momentum is deteriorating.
For example, price may produce a new high while an oscillator fails to produce a corresponding new high.
This is known as bearish divergence.
Traders interested in using momentum as additional context can read our guides to MACD divergence and RSI divergence.
Divergence does not confirm that a wedge will break lower, but it can provide additional evidence that the upward price movement is losing momentum.
5. Breakdown through support
The pattern is not complete simply because price is moving within a wedge.
Confirmation typically occurs when price closes below the lower trendline.
Waiting for confirmation can help traders avoid assuming that every narrowing upward move will reverse.
How Reliable Is the Rising Wedge Pattern?
This is where the textbook description of a rising wedge needs some context.
A rising wedge is widely described as bearish, but that does not mean every rising wedge breaks down or reaches its projected target.
Thomas Bulkowski analysed more than 1,400 rising wedge trades and found that price broke downwards approximately 60% of the time.
More importantly, only 32% of downward breakouts reached the traditional wedge price target.
Volume also declined during the formation in 79% of the rising wedges studied.
These figures reveal three different questions that traders should avoid confusing:
- Does the chart look like a rising wedge?
- Does price actually break below the wedge?
- Does the subsequent decline reach the projected price target?
They are not the same thing.
The historical data suggests that downward breakouts occurred more frequently than upward breakouts, supporting the pattern’s bearish reputation. But a 60% downside breakout rate is very different from saying a rising wedge predicts a fall with certainty.
Likewise, a breakdown does not guarantee that price will travel the full height of the wedge.
This is why confirmation and risk management matter more than simply identifying the shape.
Rising Wedge Volume
Volume can provide additional context when analysing a rising wedge.
The traditional interpretation is that volume gradually declines as the wedge develops.
Price continues climbing, but fewer market participants are supporting the move. If price subsequently breaks below support with increasing activity, the change can provide additional evidence that selling pressure is strengthening.
Bulkowski’s research found declining volume in 79% of rising wedge formations, suggesting that contracting volume is common rather than essential.
However, volume behaviour differs between markets.
Centralised stock exchanges provide direct trading-volume data, whereas spot forex does not have one central exchange recording total global currency volume. Traders analysing forex may therefore rely more heavily on price action, tick volume or momentum indicators.
Volume should consequently be treated as supporting information rather than a mandatory rule.
Rising Wedge vs Ascending Triangle
Rising wedges and ascending triangles can look similar because both involve price pushing upwards against resistance.
But their structure and conventional interpretation differ.
| Rising wedge | Ascending triangle |
| Both boundaries rise | Upper resistance is relatively flat |
| Trendlines converge | Rising support converges with horizontal resistance |
| Usually considered bearish | Usually considered bullish |
| Price becomes compressed while rising | Buyers repeatedly test a similar resistance level |
| Confirmation usually requires downside break | Bullish confirmation usually requires resistance breakout |
The easiest visual clue is the upper boundary.
If both support and resistance are rising and converging, you may be looking at a rising wedge.
If resistance is relatively horizontal while support rises underneath it, the pattern is more likely an ascending triangle.
How to Trade a Rising Wedge Pattern
There is no single required strategy for trading a rising wedge, but a typical approach focuses on confirmation rather than anticipating the breakdown.
Step 1: Identify the wedge
Look for rising highs and lows contained between two converging upward-sloping trendlines.
Check that the pattern contains enough price interaction with both boundaries to make the lines meaningful.
Step 2: Consider the wider trend
Establish whether the wedge is forming:
- At the end of an uptrend
- As a rally within a downtrend
- Inside a larger sideways market
The surrounding market structure can change how much significance traders give the formation.
Step 3: Wait for the breakdown
Instead of selling simply because a rising wedge has appeared, traders may wait for price to close below the lower trendline.
This is the point at which the bullish structure inside the wedge has actually been disrupted.
More cautious traders may wait for further confirmation, such as another bearish candle or a failed attempt to move back above the broken trendline.
Step 4: Plan the entry
One approach is to enter after a confirmed close below support.
Another is to wait for price to retest the former support line from underneath.
A retest does not always occur, so waiting for one can mean missing some moves. Entering immediately after a breakdown, however, increases exposure to false breakouts.
There is therefore a trade-off between earlier entry and additional confirmation.
Rising Wedge Stop Loss
A stop loss defines where the original trading idea is considered invalid.
For a bearish rising wedge setup, traders may consider levels such as:
- Above the most recent swing high
- Above the upper wedge boundary
- Above a failed retest following the breakdown
The appropriate location depends on the strategy and volatility of the market.
Placing a stop extremely close to the breakout can expose a position to ordinary market noise, while placing it too far away increases the amount at risk for a given position size.
Our guide explaining why stop losses get hit covers how volatility, market structure, spreads and premature entries can affect stop placement.
Rising Wedge Price Target
The traditional measured-move method uses the height of the wedge at its widest point.
For example:
- Top of widest section: $110
- Bottom of widest section: $100
- Wedge height: $10
- Breakdown: $108
The conventional projected target would be:
$108 – $10 = $98
However, this calculation should be treated as an estimate rather than an expected destination.
Bulkowski’s data found that only 32% of downward rising-wedge breakouts reached the conventional price target.
That makes the target statistic particularly useful.
Rather than automatically holding a position until the full measured move has been achieved, traders can also consider previous support levels, market structure and changing momentum when managing a position.
False Rising Wedge Breakouts
One of the biggest risks with any chart pattern is the false breakout.
Price can briefly move below wedge support before quickly recovering back inside the pattern.
This can occur because of volatility, news releases, thin liquidity or simply because the bearish setup has failed.
Possible confirmation techniques include:
- Waiting for a candle to close below support
- Looking for increasing momentum during the breakdown
- Monitoring whether broken support becomes resistance
- Looking for bearish RSI or MACD divergence before the break
- Waiting for a lower high or further bearish market structure
No combination eliminates false signals completely.
Confirmation simply requires the market to provide more evidence before a position is taken.
What Happens If a Rising Wedge Breaks Upwards?
A rising wedge is traditionally bearish, but upward breakouts do happen.
Bulkowski’s historical observations imply that around 40% of the rising wedges in his dataset broke upwards rather than downwards.
An upside break should therefore not simply be ignored because it contradicts the expected pattern.
Instead, it can be viewed as evidence that the bearish thesis failed.
This illustrates an important principle of technical analysis: price behaviour after the pattern matters more than the name given to the pattern.
If resistance breaks decisively and bullish market structure continues, traders should reassess the setup rather than continuing to expect a reversal solely because the preceding formation resembled a rising wedge.
Rising Wedge in Forex, Stocks, Indices and Crypto
The basic structure of a rising wedge can appear across different financial markets, including:
The underlying principle remains the same: price rises while its trading range contracts.
However, market characteristics can affect how the pattern behaves.
Forex trades around the clock during the trading week and reacts strongly to economic releases and monetary policy. Stocks can experience gaps following earnings or company announcements. Cryptocurrencies trade continuously and can experience particularly sharp changes in volatility.
Traders should therefore avoid assuming that a pattern observed in one market or timeframe will behave identically in another.
Advantages and Limitations of Rising Wedge Patterns
The rising wedge has several practical advantages.
It is visually recognisable, provides defined boundaries and gives traders identifiable levels for confirmation, invalidation and potential targets.
It can also be combined naturally with market structure and momentum analysis.
However, its limitations are equally important.
Trendlines can be subjective. False breakouts occur. The pattern can break upwards despite its bearish classification, and historical observations show that the traditional measured price target is reached considerably less often than the simple textbook explanation might imply.
The strongest use of a rising wedge may therefore be as a framework for analysing weakening momentum, rather than as a standalone sell signal.
Trading Rising Wedge Patterns With LQH Markets
LQH Markets provides access to forex, indices, commodities and cryptocurrency CFDs through MetaTrader 5, allowing traders to analyse chart patterns and manage positions from the same platform.
MT5 provides multiple chart timeframes, drawing tools and technical indicators that can be used to identify converging trendlines, analyse momentum and monitor potential rising wedge breakouts.
Traders can also use stop-loss and take-profit orders when planning risk around a setup. If you’re unfamiliar with the mechanics, our guide explains how to set stop loss and take profit in MT5.
Because a rising wedge is generally a bearish setup, trading a confirmed breakdown may involve taking a short position. Our guide to short selling on MT5 explains how short positions work and the risks involved.
Traders should remember that leverage magnifies both profits and losses, and no chart pattern guarantees a successful trade.
Ready to get started? Open a live LQH Markets account or practise identifying chart patterns using a demo account.
Risk disclaimer
CFDs are complex instruments with a high risk of losing all your invested capital. Only trade with money you can afford to lose. Content is for general information only and is not investment advice.
Conclusion
A rising wedge pattern occurs when price moves higher between two converging upward-sloping trendlines. Although price is still making higher highs and higher lows, the narrowing range can indicate that bullish momentum is weakening.
The pattern can act as a bearish reversal after an uptrend or a bearish continuation formation during a broader downtrend.
However, recognising the wedge is only the first stage.
Historical pattern research shows why traders should distinguish between identifying a rising wedge, confirming its breakout and expecting price to reach a projected target. In Bulkowski’s sample of more than 1,400 formations, approximately 60% broke downwards, while only 32% of downside breakouts reached the traditional price target.
Rather than assuming that every rising wedge will result in a decline, traders can wait for a break below support and assess market structure, momentum, volume and risk before making a decision.
Ultimately, the rising wedge is best viewed as evidence that an upward move may be losing strength, not a guarantee of what price will do next.
Rising Wedge Pattern FAQs
Is a rising wedge bullish or bearish?
A rising wedge is generally considered a bearish chart pattern. When it forms after an uptrend, it can indicate a potential bearish reversal. When it forms during a broader downtrend, it can act as a bearish continuation pattern. The bearish setup is normally confirmed only after price breaks below the wedge’s lower trendline.
What does a rising wedge indicate?
A rising wedge indicates that price is moving higher while the range between highs and lows is contracting. This can suggest that bullish momentum is weakening even though price continues to rise.
How do you confirm a rising wedge pattern?
A rising wedge is typically confirmed when price closes below the lower support trendline. Traders may look for additional evidence such as increased selling momentum, a retest of broken support, bearish divergence or a subsequent change in market structure.
How accurate is a rising wedge pattern?
No chart pattern has a guaranteed accuracy rate. Thomas Bulkowski’s study of more than 1,400 rising wedges found that 60% broke downwards, while 40% broke upwards. Only 32% of downside breakouts reached the traditional measured price target. Results can vary by market, timeframe and identification method.
What is the difference between a rising wedge and an ascending triangle?
A rising wedge has two upward-sloping trendlines that converge as price rises. An ascending triangle normally has rising support beneath a relatively horizontal resistance level. Rising wedges are traditionally considered bearish, whereas ascending triangles are generally interpreted as bullish patterns.
Can a rising wedge break upwards?
Yes. Although rising wedges are generally classified as bearish, they can break above resistance. Historical observations from Bulkowski found downward breakouts in around 60% of cases, meaning a substantial minority broke in the opposite direction. This is one reason traders may wait for the breakout rather than predicting its direction in advance.