

Understanding the pulse of the global economy is paramount for any serious CFD trader. Economic data releases are not just headlines; they are direct drivers of market volatility and trend shifts across various asset classes. From currency pairs to stock indices and commodity CFDs, these reports offer critical insights into the health and future direction of economies, providing opportunities for informed trading decisions.
Economic indicators are macroeconomic statistics that provide insights into the overall health and likely direction of an economy. They serve as a crucial compass for traders, policymakers, and businesses to anticipate shifts in market sentiment and asset valuations.
The Three Categories of Economic Indicators
Economic indicators are broadly categorized by their relationship to the business cycle, offering different perspectives on economic activity:
Leading Indicators: Signaling Future Shifts
Leading indicators are forward-looking metrics that tend to change before the broader economy begins to follow a particular trend. They are highly prized by traders for their predictive power, often signaling economic shifts three to twelve months in advance.
-
Examples:
- Stock Market Performance: Often considered a leading indicator, as investors price in future earnings and economic conditions.
- Building Permits & Housing Starts: An increase suggests future construction activity and economic expansion. For instance, a surge in building permits could signal increased demand for industrial materials like lumber or steel, potentially impacting related commodity CFDs.
- Manufacturing Orders: Rising orders indicate future production growth.
- Consumer Confidence Index (CCI): Surveys reflecting consumer sentiment about their financial well-being and the economy, which can predict future spending.
- Initial Jobless Claims: A weekly report on new unemployment benefit applications; a sustained rise can signal a weakening labor market.
-
Trading Insight: A strong leading indicator, such as a significant uptick in consumer confidence, might prompt traders to anticipate increased retail sales, potentially leading to bullish positions on consumer discretionary stock CFDs or the domestic currency.
Coincident Indicators: Measuring Current Activity
Coincident indicators move simultaneously with the economy, reflecting the current state of economic activity. While they don’t predict the future, they confirm that economic shifts are indeed happening in real-time.
-
Examples:
- Gross Domestic Product (GDP): The total monetary value of all goods and services produced in a country, the broadest measure of economic activity.
- Industrial Production: Measures output from manufacturing, mining, and utilities.
- Personal Income: Reflects the total income received by individuals.
- Retail Sales: Tracks consumer spending on goods.
-
Trading Insight: A robust industrial production report confirms strong current manufacturing activity, which can reinforce bullish sentiment for industrial sector stock CFDs and the overall economy.
Lagging Indicators: Confirming Trends
Lagging indicators change after the economy has already begun to follow a particular trend or pattern. They are backward-looking but valuable for confirming long-term trends and validating what leading indicators previously suggested.
-
Examples:
- Unemployment Rate: Declines after an economic recovery is underway.
- Corporate Profits: Reflect past business performance.
- Inflation (e.g., Consumer Price Index – CPI): Price increases often materialize after periods of strong demand and economic growth.
-
Trading Insight: A persistently high unemployment rate, even after other indicators show recovery, might temper expectations for aggressive central bank policy tightening, impacting bond yields and currency valuations. Lagging indicators help confirm the sustainability of observed trends.
The true power of economic indicators emerges when multiple indicators, especially leading ones, align and point in the same direction, creating a more robust signal for traders. Think of them as different gauges on an economic dashboard; while each offers a piece of information, a comprehensive understanding comes from observing all of them together.
Key Economic Indicators and Their Market Impact
Let’s delve into specific indicators and their direct influence on CFD markets.
Gross Domestic Product (GDP)
GDP is arguably the most closely watched economic indicator, representing the total monetary value of all finished goods and services produced within a country’s borders over a specific period (typically a quarter or year). It’s the primary gauge of an economy’s size and health.
-
Components and Impact:
- Consumption (Consumer Spending): The largest component. Strong consumer spending boosts retail and technology stock CFDs.
- Investment (Business Spending): Capital expenditure by businesses. Higher investment supports industrial and manufacturing stock CFDs.
- Government Spending: Public expenditure on infrastructure, defense, etc. Can stabilize the economy and boost related sectors.
- Net Exports (Exports – Imports): A trade surplus strengthens the domestic economy and currency, benefiting export-driven company CFDs.
-
Release Stages: GDP figures are released in stages:
- Preliminary (Advance): The first estimate, based on partial data, often causing the biggest market impact due to its novelty. It’s released approximately four weeks after the quarter ends.
- Revised (Second Estimate): Incorporates more complete data, refining the initial figure but typically having less impact than the advance reading.
- Final GDP: The most accurate assessment, but usually has a muted market impact unless there are significant revisions from previous estimates.
To be more precise, the Preliminary (Advance) estimate is released approximately four weeks after the quarter ends, the Revised (Second Estimate) around eight weeks, and the Final GDP about twelve weeks after the quarter ends. It’s worth noting that even after the final release, GDP figures may still be subject to further revisions in subsequent years.
- Market Impact:
- Currencies: Strong GDP growth can lead to expectations of higher interest rates (to combat potential inflation), strengthening the domestic currency. Conversely, weak GDP may signal rate cuts or stimulus, weakening the currency.
- Equity CFDs: Robust GDP growth generally correlates with higher corporate earnings and investor confidence, pushing stock index CFDs higher.
Understanding the broader economic cycle is crucial for interpreting GDP data’s impact on equity CFDs. Economies typically move through four stages: Expansion, characterized by rising GDP, employment, and corporate profits; Peak, the cycle’s highest point where growth slows; Contraction (recession), marked by declining GDP, rising unemployment, and falling profits; and Trough, the lowest point before recovery begins. During expansion, equity CFDs generally perform well due to strong corporate earnings, increased consumer spending, and robust investor confidence, pushing stock index CFDs higher. In a contraction, however, equity markets tend to decline as profits fall and uncertainty rises. Traders use GDP figures to identify which stage the economy is in, anticipating shifts in corporate performance and adjusting their equity CFD positions accordingly. For instance, early signs of an expansion (e.g., consecutive quarters of rising GDP) might prompt bullish positions on broad market indices or sector-specific CFDs like technology or consumer discretionary. Conversely, a looming contraction, signaled by slowing GDP growth, could lead to defensive strategies, short positions on vulnerable sectors, or a shift towards safe-haven assets. This macro-economic framework helps traders interpret indicator data over time, providing a crucial context for market moves.
*   **Bond Markets:** Strong GDP with rising inflation can lead to higher interest rates, reducing bond prices. Weak GDP may make bonds more appealing as [safe-haven assets](/learn/commodities/safe-haven-assets/).
*   **Commodity CFDs:** A booming economy drives demand for industrial materials like oil and metals, boosting commodity CFD prices. For example, strong US GDP growth often translates to higher global oil demand, supporting crude oil CFD prices.
Inflation Indicators: PPI and CPI
Inflation measures the rate at which the general level of prices for goods and services is rising, and consequently, the purchasing power of currency is falling. Central banks closely monitor inflation to guide monetary policy.
- Producer Price Index (PPI): Measures the average change over time in the selling prices received by domestic producers for their output. PPI is considered a leading indicator for consumer inflation. Price increases at the producer level often pass through to consumers with a lag of several months, giving traders an early signal of future inflationary pressures. Sharp PPI increases in manufacturing inputs, for example, could signal future pressure on profit margins for companies using those materials, affecting related stock CFDs.
The PPI is further broken down by industry and commodity groupings, offering granular insights. This allows traders to pinpoint inflation pressures in specific sectors, such as energy or raw materials, and anticipate how these cost increases might impact the profit margins of companies within those industries, thereby affecting their stock CFDs.
-
Consumer Price Index (CPI): Measures the average change over time in the prices paid by urban consumers for a market basket of consumer goods and services. CPI is the most widely cited measure of inflation at the retail level and is a lagging indicator.
-
Market Impact: Higher-than-expected inflation often prompts central banks to raise interest rates to cool the economy, which can strengthen the domestic currency and potentially weigh on equity and bond markets. Conversely, lower inflation might allow central banks to maintain lower rates, which can be supportive of equities.
Employment Data: Unemployment Rate & Initial Jobless Claims
The health of the labor market is a critical gauge of economic vitality, directly influencing consumer spending and overall economic growth.
- Unemployment Rate: A lagging indicator that measures the percentage of the total labor force that is unemployed but actively seeking employment. A low unemployment rate signals a strong economy, while a rising rate indicates weakness.
- Initial Jobless Claims: A leading indicator released weekly, tracking the number of individuals filing for unemployment benefits for the first time. A sustained increase in claims suggests a weakening labor market and potential economic contraction.
The Unemployment Insurance Weekly Claims Report is generally analyzed as a four-week moving average to smooth out week-to-week variance, providing a clearer trend. It’s important to note its built-in bias, as self-employed individuals, part-timers, and contract employees who lose their jobs typically do not qualify for benefits and are therefore not counted in this report.
- Market Impact: Strong employment data (low unemployment, falling jobless claims) indicates a robust economy, supporting consumer spending and potentially leading to higher interest rates, which can strengthen the currency and boost equity CFDs. For instance, a surprise drop in initial jobless claims could trigger a rally in the domestic currency as traders anticipate a stronger economy.
Consumer Confidence Index (CCI)
Released by the Conference Board, the CCI is a leading indicator that measures consumer attitudes and perceptions regarding current and future economic conditions, including their personal financial well-being.
- Market Impact: High consumer confidence often precedes increased consumer spending, which accounts for a significant portion of GDP. This can be bullish for retail sector stock CFDs and the broader economy, potentially strengthening the currency. A sharp decline in CCI, however, might signal an impending slowdown in consumer spending, leading to caution among traders.
Purchasing Managers’ Index (PMI)
The PMI, released by the Institute for Supply Management (ISM), is a composite index based on surveys of purchasing managers in the manufacturing and services sectors. It’s a leading indicator for economic activity, often proving reliable in predicting GDP growth. A reading above 50 generally indicates expansion, while below 50 suggests contraction.
- Market Impact: A strong PMI reading signals robust business activity, which can be bullish for the domestic currency, industrial stock CFDs, and potentially commodity CFDs if manufacturing demand is high. For example, a PMI reading significantly above 50 could lead to an upward revision of GDP growth forecasts, impacting currency and equity CFDs.
Housing Market Data: New Residential Construction & Existing Home Sales
The housing sector is a significant component of the economy, and its health can provide early signals of broader economic trends.
- New Residential Construction (Housing Starts): A leading indicator that includes building permits issued, housing starts, and completions. An uptick in construction activity often signals the early stages of an economic expansion, as it reflects business investment and future job creation.
- Existing Home Sales: A lagging indicator (due to data collection lag, typically two months old) focusing on demand for previously owned homes. It’s useful for predicting consumer spending, as home sales often correlate with purchases of furniture, appliances, and other goods.
It’s important to remember that the data contained in this report is typically two months old due to the time it takes for home sales to close, reinforcing its lagging nature.
- Market Impact: A healthy housing market suggests consumer confidence and economic stability, supporting growth and potentially strengthening the currency. Weakness in housing can signal an impending slowdown, impacting construction-related stock CFDs and overall economic sentiment.
Yield Curve
The yield curve plots the yields of bonds with equal credit quality but differing maturity dates. Normally, longer-term bonds offer higher yields, resulting in an upward-sloping curve. An inverted yield curve (where short-term yields are higher than long-term yields) is a powerful leading indicator that has historically preceded recessions. Traders often compare the 10-year Treasury yield against the 2-year or 3-month Treasury yields.
While an inverted yield curve has historically been a reliable predictor of recessions, it has “broken with that pattern” in recent years, adding a crucial caveat for traders. This means that while it remains a significant indicator, its predictive power should be considered alongside other economic signals.
- Market Impact: An inversion of the yield curve often triggers risk-off sentiment, leading to potential declines in equity CFDs and a flight to safe-haven assets like gold CFDs or certain currencies.
The Beige Book
Released eight times a year by the Federal Reserve, the “Beige Book” provides a qualitative summary of current economic conditions across the 12 Fed districts. While not a quantitative indicator, it offers insights into the Fed’s perspective and can foreshadow future Federal Open Market Committee (FOMC) actions.
- Market Impact: Analysts scrutinize the “Fed speak” for clues on monetary policy, which can influence interest rate expectations, bond yields, and currency movements. A subtle shift in tone, for example, could be interpreted as a precursor to a change in interest rate policy.
Integrating Economic Data into Your CFD Trading Strategy
Successfully incorporating economic data into your trading strategy requires a structured approach to navigate market volatility and capitalize on opportunities.
1. Monitor Consensus Estimates and Market Sentiment
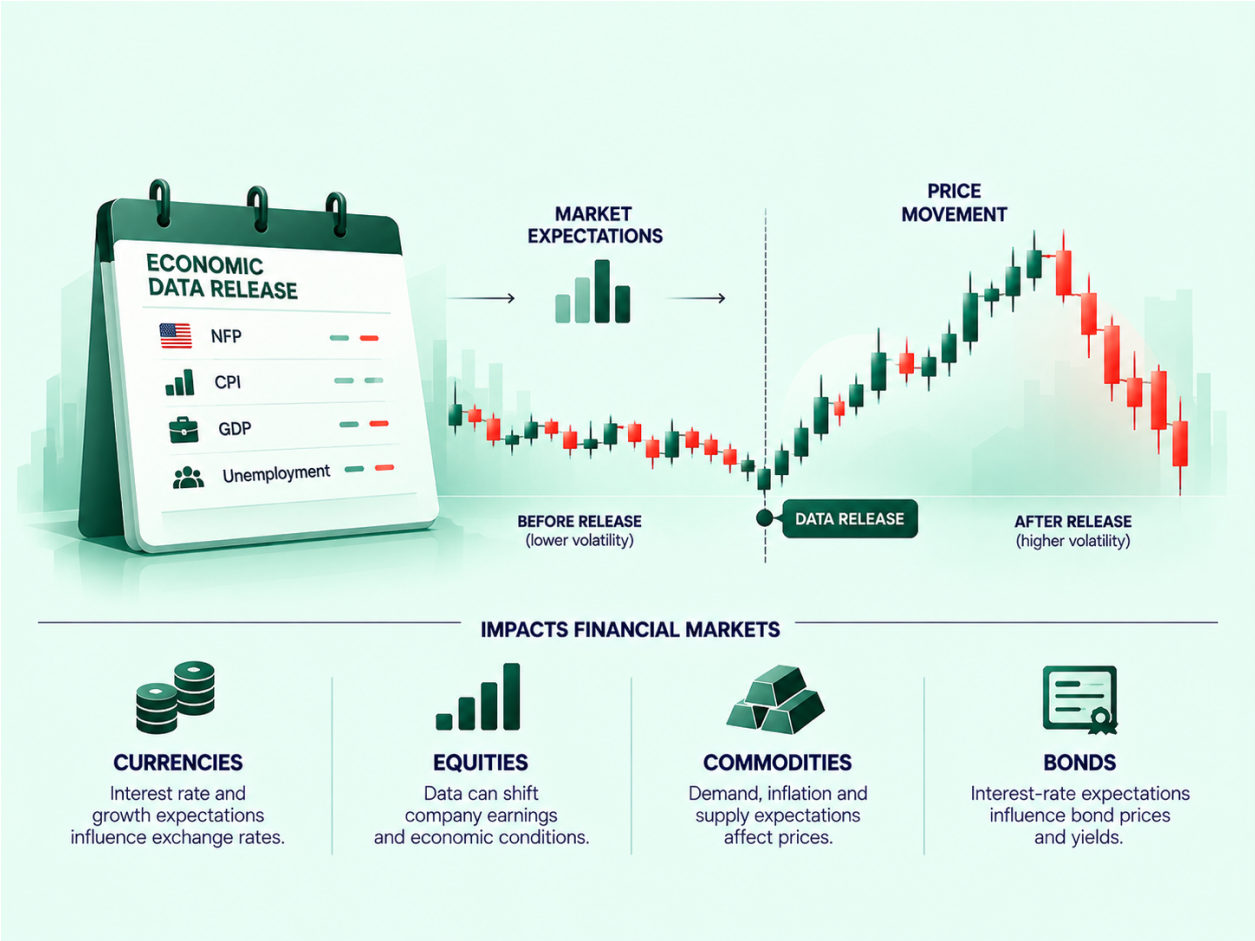
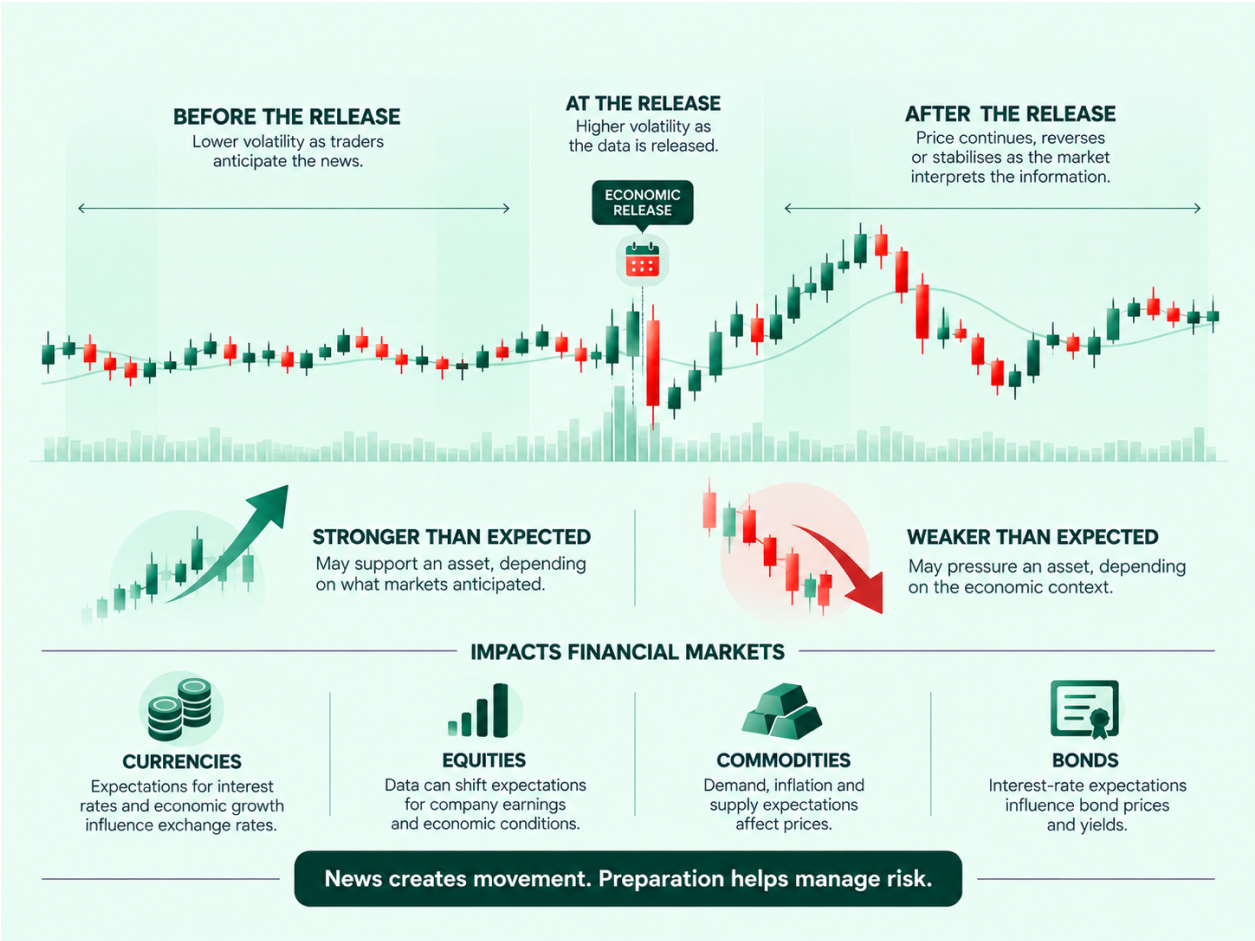
Before any major economic release, economists publish consensus forecasts. The market often prices in these expectations ahead of time.
- Actionable Insight: If the actual data significantly deviates from the consensus, expect heightened volatility. A stronger-than-expected report (a “beat”) typically strengthens the currency and related assets, while a weaker-than-expected report (a “miss”) can lead to depreciation. Gauge overall market sentiment; if expectations are already high, a positive surprise might have a muted effect, as much of the news is already priced in.
2. Understand Central Bank Reactions
Central banks (like the Federal Reserve) use economic data to formulate monetary policy. Their primary tools – interest rates, quantitative easing, and tightening – directly impact currency valuations, bond yields, and broader market liquidity.
- Actionable Insight: Strong economic growth and rising inflation typically prompt central banks to consider raising interest rates, making the domestic currency more attractive. Conversely, slowing growth or deflationary pressures may lead to rate cuts or stimulus, weakening the currency. Anticipating these policy shifts is crucial for currency CFD traders.
3. Combine with Technical Analysis
Economic data provides the fundamental context, but technical analysis helps with timing entries and exits.
- Actionable Insight: If a positive GDP report confirms a bullish trend, use technical indicators like moving averages or the Relative Strength Index (RSI) to identify optimal entry points. Conversely, a bearish report might confirm a breakdown below key support levels, signaling short opportunities. This synergy between fundamental and technical analysis can refine trade execution.
4. Implement Robust Risk Management
Economic data releases are notorious for causing sharp price swings, slippage, and whipsaw price action.
- Actionable Insight: Always use effective stop-loss strategies to limit potential losses. Consider reducing position sizes during high-impact releases. Waiting for the initial volatility to subside and for a clearer trend to emerge before entering a trade can also mitigate risk, preventing emotional decisions during peak market noise.
High-impact economic data releases present specific risks that require advanced mitigation strategies. These include:
- Increased Volatility: Prices can swing wildly in both directions, making it difficult to predict short-term movements.
- Slippage: Orders may be executed at a price different from the intended one, especially during rapid price changes.
- Whipsaw Price Action: Markets can reverse direction quickly, trapping traders on the wrong side of a move.
- Unexpected Stop-Outs: Volatility can trigger stop-loss orders prematurely, even if the market eventually moves in the anticipated direction.
- Liquidity Issues: During extreme volatility, liquidity can dry up, making it harder to enter or exit trades at desired prices.
- Market Overreaction: Initial reactions to data can be exaggerated, only to correct later.
To counter these, consider:
- Reduced Leverage: Lowering your leverage during these periods significantly reduces exposure to large swings.
- Confirmation Trading: Instead of trading immediately, wait for the market to establish a clear direction after the initial data shock.
- Wider Stop-Losses (with smaller position sizes): This can help avoid premature stop-outs due to whipsaw, but must be coupled with a reduced position size to maintain acceptable risk per trade.
- Monitoring Revisions: Be aware that initial data releases are often revised. Subsequent revisions can also move markets.
- Cross-Checking: Always cross-reference high-impact data with other indicators to build a more robust thesis.
- Focus on Major Assets: Trade highly liquid assets (e.g., major currency pairs, large-cap indices) where slippage and liquidity issues might be less severe than in exotic pairs or smaller-cap stocks.
5. Consider the Broader Economic Context
No single indicator tells the whole story. A holistic view, considering the interplay between various indicators, provides a more comprehensive picture.
- Actionable Insight: For example, strong GDP growth combined with low inflation might suggest room for continued expansion without immediate central bank tightening, which could be very bullish for equity CFDs. Conversely, strong GDP but rising unemployment could signal an uneven recovery, warranting caution.
6. Recognize Global Interconnectedness
Major economies’ data releases have ripple effects across global markets.
- Actionable Insight: Strong US GDP can signal global growth, influencing risk assets worldwide. China’s GDP is critical for commodity CFDs, as it’s a leading consumer of industrial metals and energy. Monitor data from key economies like the Eurozone and Japan, as surprises can impact global investor confidence and risk appetite. A slowdown in China, for instance, could weigh heavily on copper or iron ore CFDs globally.
Conclusion
Mastering the impact of economic data is an ongoing process of learning and adaptation. By understanding the nuances of leading, coincident, and lagging indicators, their specific market impacts, and how they influence central bank policy, CFD traders can develop more informed and resilient strategies. Integrating this fundamental knowledge with sound technical analysis and disciplined risk management forms the bedrock of successful trading in dynamic financial markets.
Frequently Asked Questions
How do “market expectations” influence the reaction to economic data?
Market expectations, or consensus forecasts, are crucial because financial markets often price in anticipated data before its release. If actual data aligns with expectations, the market reaction is typically muted. However, significant deviations (either stronger or weaker than expected) can trigger sharp volatility as traders adjust positions to reflect the new information.
Why is GDP considered so important for CFD traders across different asset classes?
GDP is a comprehensive measure of a country’s economic health, directly influencing corporate earnings, consumer spending, and central bank policy. For CFD traders, strong GDP growth can signal potential interest rate hikes (benefiting currencies), increased corporate profits (boosting equity CFDs), and higher demand for raw materials (lifting commodity CFDs), making it a fundamental driver across multiple markets.
What is the main difference between the Producer Price Index (PPI) and the Consumer Price Index (CPI) for traders?
The PPI measures price changes at the producer level, making it a leading indicator for future inflation, as producer costs often pass to consumers. The CPI, conversely, measures price changes at the consumer level and is a lagging indicator of retail inflation. Traders use PPI for early signals of inflationary pressure and CPI to confirm the actual impact on consumer purchasing power and central bank policy.
How does an inverted yield curve signal potential economic trouble?
An inverted yield curve occurs when short-term bond yields are higher than long-term bond yields, an unusual market condition. Historically, this phenomenon has reliably preceded economic recessions, as it suggests investors anticipate weaker future economic growth and potentially lower interest rates, making it a powerful leading indicator of impending economic slowdowns.
Knowledge Check
1. Which of the following is considered a leading economic indicator?
- A) Unemployment Rate
- B) Gross Domestic Product (GDP)
- C) Consumer Price Index (CPI)
- D) Initial Jobless Claims
2. A stronger-than-expected Gross Domestic Product (GDP) report typically has what effect on the domestic currency?
- A) It tends to weaken the currency due to inflation concerns.
- B) It tends to strengthen the currency due to expectations of higher interest rates.
- C) It has no significant impact as GDP is already priced in.
- D) It causes the currency to become more volatile without a clear direction.
3. Why is the Purchasing Managers’ Index (PMI) closely watched by Wall Street?
- A) It is a lagging indicator that confirms past economic trends.
- B) It directly measures consumer spending, the largest component of GDP.
- C) It has historically been reliable in predicting future GDP growth.
- D) It provides a qualitative summary of economic conditions from the Federal Reserve.
Click to view the answers
1. **D) Initial Jobless Claims** – Initial Jobless Claims are a leading indicator, providing early signals about the health of the labor market and potential economic shifts.
2. **B) It tends to strengthen the currency due to expectations of higher interest rates.** – Strong GDP growth often leads to expectations of higher interest rates from central banks, which typically strengthens the domestic currency.
3. **C) It has historically been reliable in predicting future GDP growth.** – Despite its sample size, the PMI is closely watched because it has consistently proven to be a reliable predictor of future GDP growth.