

The Nasdaq 100 and S&P 500 are two of the most influential stock market indices globally, representing the performance of leading U.S. companies. For traders seeking exposure to these dynamic markets without direct asset ownership, Contracts for Difference (CFDs) offer a flexible and leveraged avenue. This guide provides a comprehensive overview of how to approach trading Nasdaq 100 and S&P 500 CFDs, covering everything from understanding the indices to developing robust trading strategies.
Contracts for Difference (CFDs) are financial derivatives that allow traders to speculate on the price movements of underlying assets like indices, shares, or commodities, without actually owning the asset. Profits or losses are determined by the difference between the opening and closing prices of the trade.
Understanding the Nasdaq 100 and S&P 500 Indices
Before diving into CFD trading, it’s crucial to grasp what each index represents and how its value is determined.
The Nasdaq 100
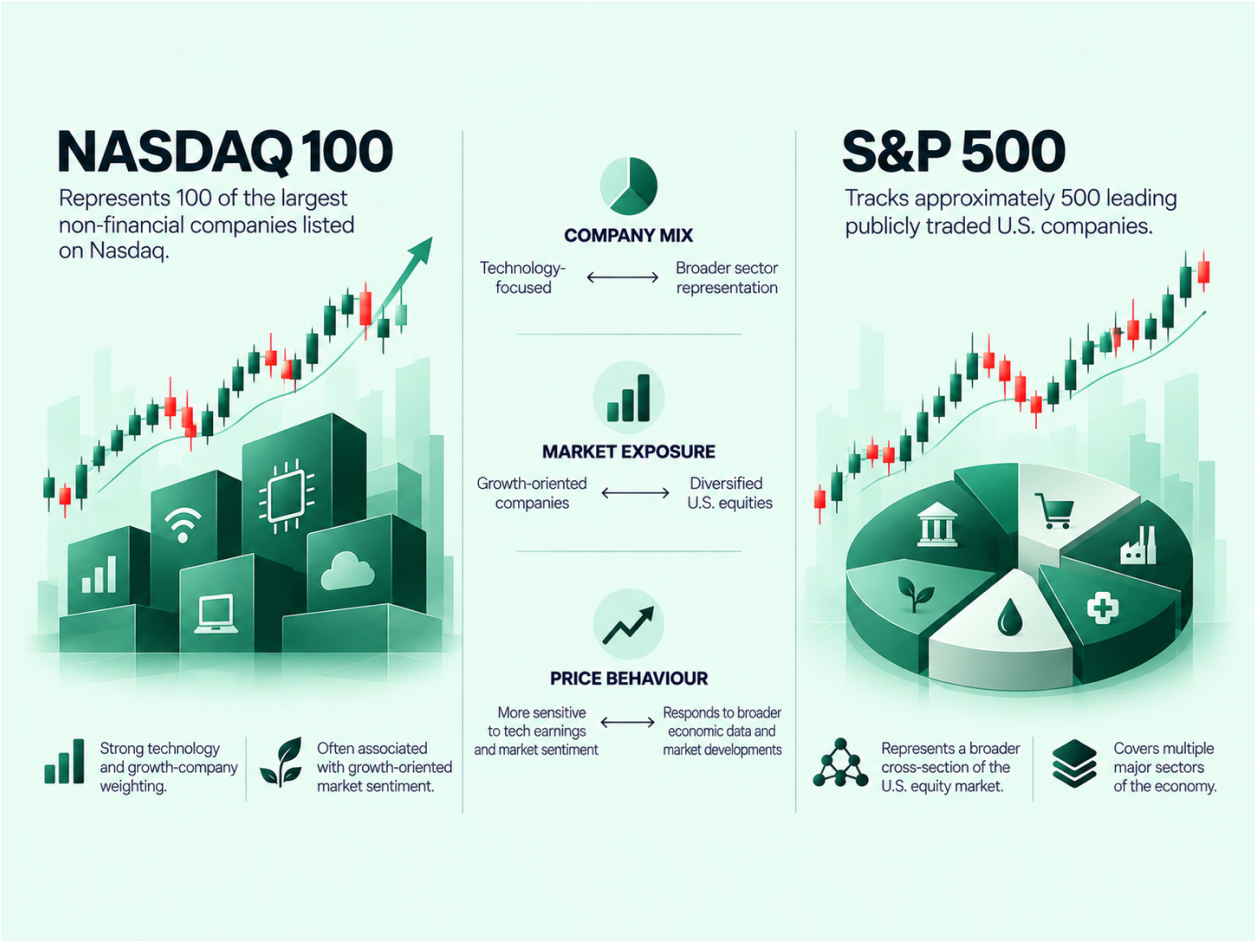
The Nasdaq 100 is a modified market-capitalization-weighted index comprising 100 of the largest non-financial companies listed on the Nasdaq stock exchange. It is heavily skewed towards technology and growth-oriented sectors, featuring household names like Apple, Microsoft, Amazon, and Tesla. Its weighting means that companies with larger market capitalizations exert a greater influence on the index’s overall value. For instance, a significant price movement in Apple’s stock will have a more pronounced effect on the Nasdaq 100 than a similar percentage move in a smaller constituent. The index undergoes an annual re-ranking to ensure it accurately reflects the top 100 non-financial firms by market capitalization. This annual re-ranking is an automatic, market-capitalization-driven process, ensuring the index consistently represents the 100 largest non-financial companies listed on the Nasdaq exchange.
The S&P 500
The S&P 500 is a market-capitalization-weighted index that tracks the performance of 500 of the largest publicly traded companies in the United States. Unlike the Nasdaq 100, which is automatically determined by market cap and sector, the S&P 500’s constituents are selected by a committee based on criteria such as market size, liquidity, and sector representation. This committee ensures the index remains a broad and representative benchmark for the U.S. equity market, encompassing a wider array of sectors beyond just technology. Companies like Berkshire Hathaway, Alphabet, and Meta are prominent members. Similar to the Nasdaq 100, larger companies in the S&P 500 have a greater impact on the index’s movements.
Why Trade Nasdaq 100 and S&P 500 CFDs?
Trading CFDs on these indices offers several distinct advantages for speculative traders:
- Leverage: CFDs allow you to open a position much larger than your initial capital outlay. For example, with 1:20 leverage, a $1,000 margin could control a $20,000 position. While this amplifies potential profits, it also significantly magnifies potential losses, making robust risk management essential.
- Go Long or Short: You can profit from both rising and falling markets. If you anticipate the index price will increase, you can “buy” (go long). If you expect it to fall, you can “sell” (go short).
- 24/5 Market Access: Many CFD brokers offer continuous trading on major indices like the Nasdaq 100 and S&P 500, often from Monday to Friday, allowing traders to react to global news and events outside standard U.S. market hours.
- Diversified Exposure: Trading an index CFD provides exposure to a broad basket of companies with a single trade, rather than having to analyze and invest in individual stocks.
- No Direct Ownership: You don’t own the underlying shares, which simplifies the trading process by removing concerns like stock certificates, voting rights, or physical delivery.
Types of Index CFDs
CFD brokers typically offer various ways to trade indices, each with its own characteristics:
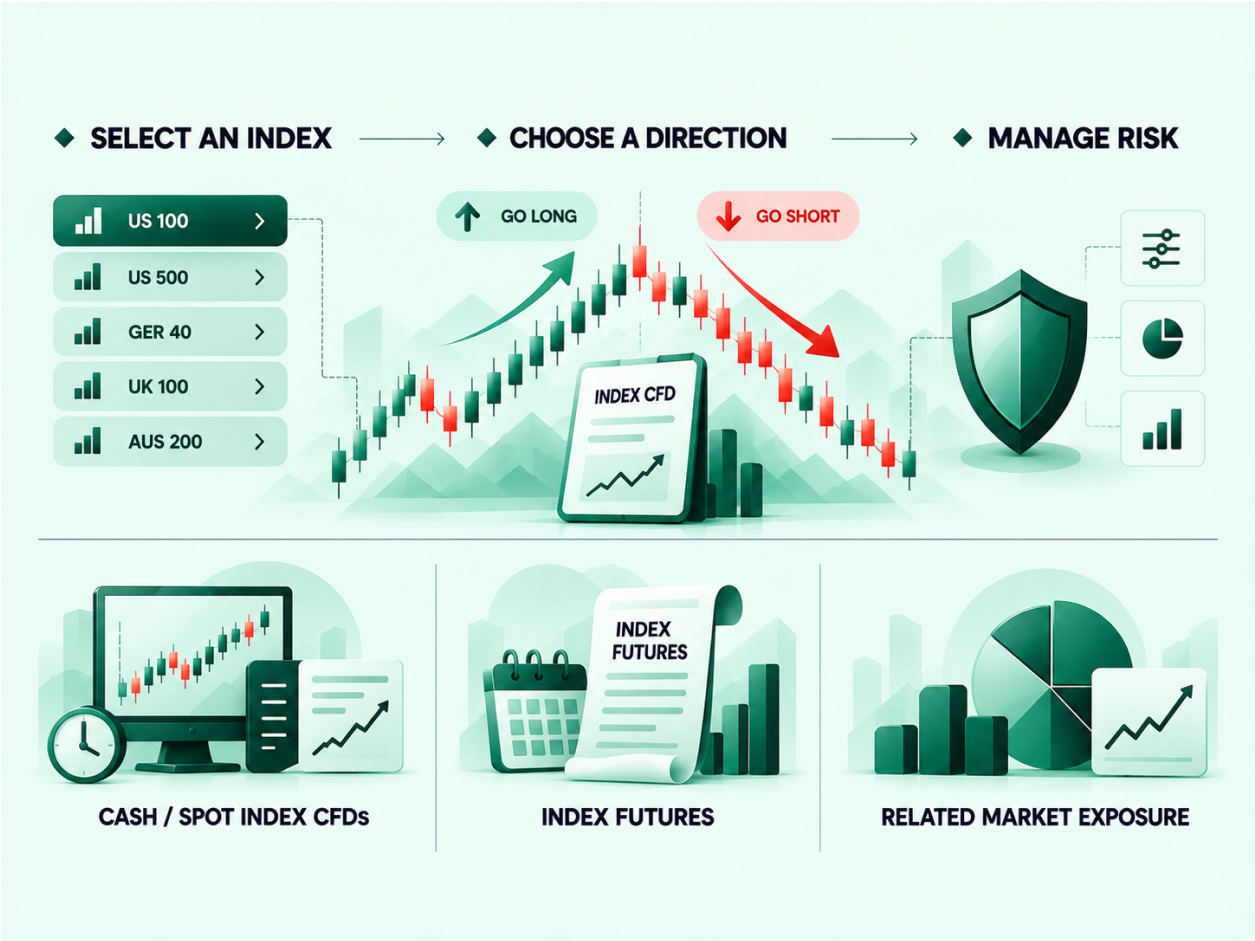
1. Cash (Spot) Index CFDs
- Description: These CFDs track the current, real-time price of the underlying index. They aim to provide the closest reflection of the live market price.
- Characteristics: Generally feature tighter spreads compared to futures. However, positions held overnight typically incur funding charges, making them more suitable for short-to-medium term trading strategies like day trading or swing trading.
- Example: A trader anticipating a short-term rally in the S&P 500 might open a cash CFD position, aiming to close it before the end of the trading day to avoid overnight fees.
2. Index Futures CFDs
- Description: Futures CFDs (not available with LQH Markets) allow you to speculate on the price of an index at a specific date in the future. The price incorporates the cost of carry (interest rates and dividends) until the expiry date.
- Characteristics: Futures CFDs typically have wider spreads than cash CFDs but do not incur overnight funding charges, making them potentially more cost-effective for medium-to-long term strategies.
- Example: A trader expecting the Nasdaq 100 to appreciate over the next three months might open a futures CFD with a three-month expiry, holding it without daily overnight charges.
3. Index Options CFDs
- Description: Options CFDs (not available with LQH Markets) give the buyer the right, but not the obligation, to buy (call option) or sell (put option) an index at a predetermined price (strike price) on or before a specific expiry date.
- Characteristics: When buying options, your risk is limited to the premium paid. However, selling options carries potentially unlimited risk, as the market price can move indefinitely against your position. They offer unique strategic possibilities for hedging or speculating on volatility.
- Example: A trader expecting a sharp, but not necessarily sustained, drop in the S&P 500 might buy a put option CFD, benefiting from the decline while limiting their maximum loss to the premium.
Detailed CFD Cost Considerations
Detailed Cost Considerations
Beyond the general mention of overnight fees, understanding the specific cost structure for different CFD types is crucial for effective trading.
- Direct Index CFDs (Cash/Spot): When trading cash (spot) index CFDs, such as the Nasdaq 100 or S&P 500, brokers often offer these as “commission-free.” Instead, the cost is built into the spread – the difference between the buy and sell price. However, as noted, these positions typically incur overnight funding charges if held past the market close.
- Index Futures CFDs: Futures CFDs generally do not have separate overnight funding charges. Instead, the cost of carry (interest rates and dividends) is already factored into the wider spread of the futures contract itself. This can make them more cost-effective for longer-term positions.
- ETF and Single Stock CFDs: Trading CFDs on Exchange Traded Funds (ETFs) or individual shares usually involves a combination of costs. You will typically pay a commission per trade, often with a minimum fee (e.g., $15 for US share CFDs, or 2 cents per share with a $15 minimum for ETFs). Additionally, like cash index CFDs, these positions will incur overnight funding charges if held open overnight. Always review your broker’s fee schedule to understand the full cost implications for your chosen instrument.
Trading Beyond the Index: ETF and Single Stock CFDs
While direct index CFDs offer broad market exposure, you can also use CFDs to target specific components:
1.
- Description: Exchange Traded Fund (ETF) CFDs (not available with LQH Markets) allow you to speculate on the price of an ETF that tracks an index like the Nasdaq 100 or S&P 500. These ETFs hold a basket of shares mirroring the index’s composition.
- Characteristics: Offer diversified exposure similar to direct index CFDs but may have lower liquidity and wider spreads than direct index CFDs. They also typically incur overnight funding charges, and commissions apply based on the chosen account type (e.g., $3 per side per standard lot for Raw Spread accounts, or zero for Zero Commission accounts).
- Example: Instead of trading the Nasdaq 100 index directly, a trader might choose an ETF CFD like the Invesco QQQ Trust, which tracks the Nasdaq 100, if they prefer the specific structure or liquidity profile of the ETF.
2. Single Stock CFDs
- Description: These CFDs allow you to speculate on the price movements of individual company shares listed on the Nasdaq or included in the S&P 500 (e.g., Apple, Amazon, Tesla).
- Characteristics: Offers targeted exposure to specific companies. Like other cash CFDs, they typically incur overnight funding charges and minimum commissions. They are also leveraged, meaning profits and losses are based on the full position size.
- Example: A trader might have a strong conviction about Tesla’s future performance but not the broader Nasdaq 100. They could open a Tesla share CFD to capitalize on that specific company’s movements.
Developing Your Trading Strategy
Successful CFD trading on indices requires a well-defined strategy and disciplined execution.
1. Define Your Trading Style
Your approach should align with your personality, time commitment, and risk tolerance:
- Scalping: Executing numerous small trades over very short periods (seconds to minutes) to capture tiny price discrepancies. Requires intense focus and rapid decision-making.
- Day Trading: Opening and closing positions within a single trading day to avoid overnight fees and risks. Focuses on intraday price movements.
- Swing Trading: Holding positions for several days or weeks to profit from larger price swings. Involves analyzing daily or weekly charts.
- Position Trading: Holding positions for weeks, months, or even longer, based on long-term trends and fundamental analysis.
2. Technical Analysis and Indicators
Technical analysis involves studying price charts and volume to predict future price movements. Key tools include:
- Chart Patterns: Recognizing recurring patterns like head and shoulders, triangles, or flags to anticipate reversals or continuations.
- Support and Resistance Levels: Identifying price levels where buying or selling pressure is expected to be strong.
- Momentum Indicators: Tools like the Relative Strength Index (RSI) or Stochastic Oscillator can signal overbought or oversold conditions, helping identify potential turning points.
- Moving Averages: Used to identify trends and potential dynamic support/resistance levels.
3. Fundamental Analysis
While technical analysis focuses on price, fundamental analysis considers economic data, company news, and geopolitical events that can influence index values:
- Economic Data: GDP reports, inflation figures, interest rate decisions, and employment data can significantly impact market sentiment and index performance.
- Earnings Reports: Strong or weak earnings from major constituent companies can move the entire index, especially for market-cap-weighted indices.
- Industry News: Developments in key sectors (e.g., tech innovations, regulatory changes) can affect the Nasdaq 100.
- U.S. Dollar Strength: A stronger dollar can sometimes make U.S. exports more expensive, potentially impacting multinational companies within the indices.
4. Risk Management
Given the leveraged nature of CFDs, robust risk management is paramount:
- Stop-Loss Orders: Automatically close a losing position when the price reaches a predetermined level, limiting potential losses.
- Take-Profit Orders: Automatically close a winning position when the price reaches a target level, securing profits.
- Position Sizing: Determine the appropriate number of contracts to trade based on your account size and risk tolerance. Never risk more than a small percentage of your capital on a single trade (e.g., 1-2%).
- Diversification: While indices offer inherent diversification, avoid over-concentration in a single CFD type or market.
- Capital Preservation: Only trade with capital you can afford to lose.
5. Trading Alerts
Set up alerts to notify you via email, SMS, or push notification when an index or stock reaches a specific price level or triggers a technical indicator. This allows you to monitor markets efficiently without constant screen time.
Steps to Trading Nasdaq 100 and S&P 500 CFDs
- Educate Yourself and Plan: Understand the intricacies of CFDs, the indices, and develop a comprehensive trading plan outlining your style, strategy, risk management rules, and financial goals.
- Open a CFD Trading Account: Choose a reputable broker that offers competitive spreads, reliable execution, and a user-friendly platform. Complete the application and verification process.
- Fund Your Account: Deposit funds into your trading account. Start with an amount that allows for proper risk management and position sizing.
- Choose Your Instrument: Decide whether you want to trade the cash index, futures, options, an ETF CFD, or a single stock CFD, based on your strategy and market outlook.
- Analyze and Execute: Use your chosen analytical methods (technical, fundamental) to identify trading opportunities. Place your trade, specifying whether you’re going long or short, your desired deal size, and crucial risk management tools like stop-loss and take-profit orders.
- Monitor and Manage: Continuously monitor your open positions and the market. Be prepared to adjust your strategy or close positions if market conditions change or your initial thesis is invalidated.
Executing Your First Index CFD Trade
Once you’ve completed your analysis and identified a trading opportunity, the actual process of placing an index CFD trade on your broker’s platform typically follows these practical steps:
- Select Your Instrument: Navigate to the ‘Indices’ section of your trading platform. Here, you’ll choose the specific index you wish to trade (e.g., US Tech 100 for Nasdaq 100, or US 500 for S&P 500). You’ll also decide between the ‘Cash’ (spot) option for short-term trades or ‘Futures’ for longer-term positions, if available.
- Choose Your Direction: Based on your analysis, decide whether you want to “buy” (go long) if you expect the index price to rise, or “sell” (go short) if you anticipate a fall.
- Specify Deal Size: Enter the number of contracts you wish to trade. This “deal size” directly impacts your potential profit or loss and should align with your risk management strategy and account equity.
- Set Stop-Loss and Take-Profit Orders: This is a critical risk management step.
- Stop-Loss: Set a price level at which your trade will automatically close to limit potential losses if the market moves against you.
- Take-Profit: Set a target price level at which your trade will automatically close to secure profits if the market moves in your favor.
- Review and Place Trade: Double-check all the details of your order – instrument, direction, size, stop-loss, and take-profit levels. Once confirmed, click “Place Deal” or “Open Position” to execute your trade.
Trading Nasdaq 100 and S&P 500 CFDs offers exciting opportunities for traders to speculate on the performance of the U.S. economy’s titans. By understanding the nuances of each index, leveraging the flexibility of CFDs, and adhering to disciplined risk management, traders can navigate these dynamic markets with greater confidence.
Frequently Asked Questions
How are the Nasdaq 100 and S&P 500 indices weighted?
Both the Nasdaq 100 and S&P 500 are market-capitalization-weighted indices. This means that companies with larger market values (share price multiplied by the number of outstanding shares) have a greater influence on the index’s overall performance compared to smaller companies.
What are the main differences between trading cash (spot) index CFDs and futures index CFDs?
Cash (spot) index CFDs offer real-time pricing and tighter spreads but incur overnight funding charges, making them suitable for short-term trades. Futures index CFDs have wider spreads but typically do not have overnight funding charges, making them more appealing for medium-to-long term positions.
Can I trade individual Nasdaq 100 or S&P 500 company shares using CFDs?
Yes, you can trade individual company shares listed on the Nasdaq or included in the S&P 500 via CFDs. This allows you to target specific companies like Apple or Amazon with leverage, without taking direct ownership of the shares.
What are the typical market hours for Nasdaq 100 and S&P 500 CFD trading?
While the underlying U.S. stock exchanges have standard hours (9:30 AM to 4:00 PM EST), many CFD brokers offer extended trading hours, often providing 24/5 access to Nasdaq 100 and S&P 500 index CFDs from Monday to Friday. This allows traders to react to global news and events outside regular market hours.
Knowledge Check
1. Which of the following is a primary characteristic of the Nasdaq 100 index?
- A) It comprises the 500 largest U.S. companies across all sectors.
- B) It is a market-capitalization-weighted index of 100 largest non-financial companies on the Nasdaq.
- C) Its constituents are chosen by an independent committee.
- D) It is primarily composed of financial sector companies.
2. What is a key advantage of trading index CFDs compared to owning the underlying shares?
- A) CFDs provide voting rights in the constituent companies.
- B) CFDs eliminate all trading fees and commissions.
- C) CFDs allow traders to profit from both rising and falling markets through leverage.
- D) CFDs guarantee profits due to their leveraged nature.
3. If a trader wants to avoid overnight funding charges for a medium-term position on the S&P 500, which CFD type would generally be more suitable?
- A) Cash (Spot) Index CFD
- B) Single Stock CFD
- C) Index Futures CFD
- D) ETF CFD
Click to view the answers
1. **B)** – The Nasdaq 100 is a market-capitalization-weighted index of 100 largest non-financial companies on the Nasdaq.
2. **C)** – CFDs allow traders to go both long and short, enabling profit potential in both rising and falling markets, amplified by leverage.
3. **C)** – Index Futures CFDs typically do not incur overnight funding charges, making them more suitable for medium-to-long term positions compared to cash or .