


Navigating the complexities of financial markets requires a robust analytical framework. Traders and investors often find themselves at a crossroads, debating the merits of two primary methodologies: fundamental analysis and technical analysis. While seemingly distinct, understanding their individual strengths and how they can complement each other is crucial for developing a comprehensive trading strategy, particularly in the dynamic world of Contracts for Difference (CFDs).
Fundamental analysis seeks to determine an asset’s intrinsic value by evaluating its underlying financial health and broader economic factors. Technical analysis, conversely, forecasts future price movements by analyzing historical price charts, volume, and statistical indicators.

This guide will delve into each approach, comparing their core tenets, applications, and how their synergy can empower more informed decision-making.
Understanding Fundamental Analysis
Fundamental analysis is akin to a deep dive into the intrinsic worth of an asset. It operates on the premise that every asset has an inherent value, which may not always be reflected in its current market price. Traders employing this method aim to identify discrepancies between an asset’s market price and its true value, anticipating that the market will eventually correct itself.
Core Principles and Data Sources
Fundamental analysis primarily focuses on the “why” behind price movements. For stocks, this involves scrutinizing a company’s financial statements (balance sheet, income statement, cash flow statement), management quality, competitive landscape, and industry outlook. For currencies, it entails evaluating macroeconomic indicators such as interest rates, inflation, GDP growth, employment figures, and geopolitical stability. Commodity analysis might involve supply and demand dynamics, production levels, and global economic health.
Key data sources include:
- Financial Reports: Quarterly and annual earnings reports, 10-K and 10-Q filings.
- Economic Data: Central bank announcements, inflation reports (CPI), unemployment rates, GDP figures.
- Industry News: Sector-specific developments, regulatory changes, technological advancements.
- Qualitative Factors: Management expertise, brand strength, intellectual property, corporate governance.
Strengths of Fundamental Analysis
- Long-Term Perspective: Provides a robust framework for identifying assets with strong long-term growth potential or inherent value.
- Comprehensive Understanding: Offers a deep insight into the underlying health and drivers of an asset, moving beyond mere price fluctuations.
- Identifies Undervaluation/Overvaluation: Helps pinpoint assets trading below their intrinsic value (potential buy) or above (potential sell).
Limitations of Fundamental Analysis
- Backward-Looking Data: Much of the financial and economic data used is historical, making future forecasting subjective and prone to error.
This backward-looking nature is a significant criticism, often encapsulated by the phrase “Garbage In, Garbage Out” (GIGO) when applied to intrinsic value modeling. While fundamental analysis often assumes the Efficient Market Theory (EMT) holds in the long run—meaning market prices reflect all available information—fundamentalists aim to capitalize on short-term market inefficiencies. However, the reliance on historical data and management’s often optimistic future expectations can introduce subjectivity and potential biases into financial forecasts. This can lead to flawed intrinsic value determinations, as the models are only as good as the inputs, which are inherently historical and subject to interpretation.
- Slow to React: Fundamental shifts often take time to manifest in price, making it less suitable for short-term trading opportunities.
- Market Sentiment Gaps: It may not account for sudden, irrational market sentiment shifts or “black swan” events that can drastically impact prices without a clear fundamental trigger.
- Ineffective in Bear Markets: While identifying value, it offers little protection against sustained market downturns or panics.
Example in CFD Trading:
Imagine a CFD trader analyzing a major tech company. A fundamental approach would involve examining its latest earnings report, noting robust revenue growth, expanding profit margins, and a healthy balance sheet. The trader might also consider the company’s innovation pipeline, market share, and the overall economic outlook for the tech sector. If these factors suggest the company is fundamentally strong and potentially undervalued, the trader might open a long CFD position, anticipating long-term appreciation.
Exploring Technical Analysis
Technical analysis, in contrast, zeroes in on the “what” and “when” of market movements. It operates on the principle that all available information, including fundamental factors, is already reflected in an asset’s price. Therefore, by studying historical price action, volume, and various indicators, traders can identify patterns and trends that offer clues about future price direction.
The roots of technical analysis stretch back to the late 19th century, notably with Charles Dow, the founder of The Wall Street Journal. Dow’s series of articles laid the groundwork for what became known as Dow Theory, a foundational concept in technical analysis. He also pioneered the creation of the first stock index, the Dow 12 Industrial Average, which later evolved into the Dow 30. Initially, technical analysis was often perceived as a “fringe theory” compared to the more established fundamental analysis, struggling to gain widespread acceptance among institutional investors throughout much of the 20th century. However, its practical application and focus on market psychology gradually resonated with individual investors and retail traders, leading to its increasing popularity and integration into modern trading strategies.
Core Principles and Tools
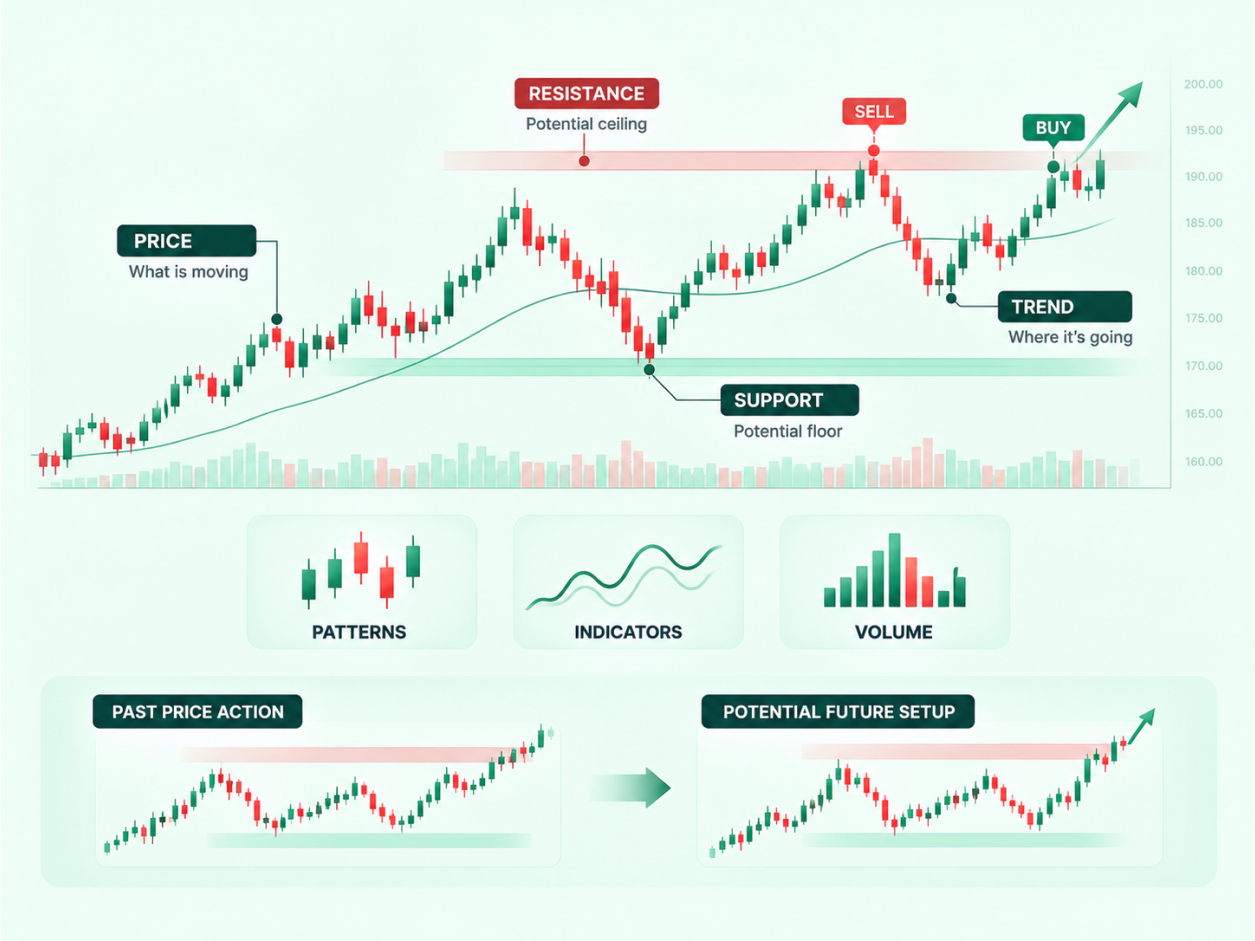
Technical analysis asserts that prices move in trends, and history tends to repeat itself due to consistent market psychology. It focuses on chart patterns, support and resistance levels, and mathematical indicators derived from price and volume data.
Key tools and concepts include:
- Chart Patterns: Formations like head and shoulders, double tops/bottoms, triangles, flags, and pennants that suggest potential reversals or continuations.
- Support and Resistance: Price levels where buying or selling pressure is expected to be strong enough to halt or reverse a trend.
- Technical Indicators: Mathematical calculations applied to price and volume data, such as Moving Averages (MA), Relative Strength Index (RSI), Moving Average Convergence Divergence (MACD), and Bollinger Bands. These help identify momentum, overbought/oversold conditions, and trend strength.
- Volume: The number of units traded, which can confirm the strength of a price move or pattern.
Strengths of Technical Analysis
- Identifies Entry and Exit Points: Highly effective for pinpointing precise moments to enter or exit a trade, optimizing risk-reward.
- Versatile Timeframes: Applicable across all timeframes, from minute-by-minute scalping to long-term trend following.
- Real-Time Market Sentiment: Captures the immediate psychological dynamics of the market, allowing traders to react quickly.
- Clear Visual Cues: Charts provide a visual representation of market behavior, making patterns and trends easier to spot.
Limitations of Technical Analysis
- Self-Fulfilling Prophecy: The widespread use of certain patterns can sometimes make them work, but this doesn’t inherently prove their predictive power.
- Patterns Can Fail: Chart patterns and indicator signals are not guaranteed and can fail unexpectedly, especially during unforeseen market shocks or news events.
- Subjectivity: Interpretation of charts and indicators can be subjective, leading different analysts to draw different conclusions from the same data.
- Lagging Indicators: Many indicators are derived from past price data, meaning they can lag behind real-time market changes.
Example in CFD Trading:
Consider a CFD trader looking at a currency pair like EUR/USD. A technical approach might involve observing that the pair has repeatedly found support at 1.0800 and resistance at 1.1000. The trader might also notice a bullish engulfing candlestick pattern forming near the support level, coupled with the RSI moving out of oversold territory. This confluence of signals could prompt the trader to open a long CFD position, aiming to profit from a move towards the resistance level.
Comparing the Two Approaches: A Side-by-Side View
While both analyses aim to inform trading decisions, their methodologies, time horizons, and underlying assumptions differ significantly:
| Feature | Fundamental Analysis | Technical Analysis |
|---|---|---|
| Primary Focus | “Why” an asset’s price should move (intrinsic value) | “What” and “When” an asset’s price is moving (patterns) |
| Time Horizon | Long-term (months to years) | Short to medium-term (minutes to weeks) |
| Data Sources | Financial statements, economic reports, news | Price charts, volume, technical indicators |
| Core Assumption | Market price will eventually reflect intrinsic value | All information is priced in; history repeats |
| Goal | Identify undervalued/overvalued assets | Predict price direction and timing of moves |
Real-Time Market Sentiment and Bridging Contradictions
One of technical analysis’s distinct advantages is its ability to capture real-time market sentiment, often reflecting collective investor actions even before official news disclosures. The immediate price movements on a chart can signal shifts in supply and demand that precede fundamental announcements. While technical patterns can dominate short-term price action, especially in the absence of major news, it’s generally understood that in the long run, fundamental factors tend to “win” and ultimately drive the technicals.
When contradictions arise—for instance, a fundamentally strong company showing weak technicals—it often signals a temporary market inefficiency or a shift in sentiment that hasn’t yet been reflected in financial reports. Indicators like price volatility can bridge these analyses; high volatility is a technical signal of increased risk, but it can also be a leading indicator hinting at underlying fundamental changes or uncertainty that could soon impact the asset’s intrinsic value. In such cases, both technical and fundamental perspectives might converge on a similar buy/sell decision, albeit for different reasons.
The Power of Synergy: Combining Analyses
The most sophisticated and often successful traders do not exclusively adhere to one methodology. Instead, they recognize that fundamental and technical analysis are complementary tools that, when combined, offer a more holistic and robust view of the market. This integrated approach helps to mitigate the shortcomings of each individual method.
How to Combine Them Effectively:
-
Fundamental Analysis for “What to Trade”: Start by using fundamental analysis to identify assets or sectors with strong underlying health, positive growth prospects, or compelling economic drivers. This helps filter out weak assets and focuses your attention on high-potential opportunities.
- Example: A trader might identify a pharmaceutical company with a promising new drug in its pipeline and strong financial stability through fundamental research.
-
Technical Analysis for “When to Trade”: Once a fundamentally sound asset is identified, switch to technical analysis to determine optimal entry and exit points. This involves looking for favorable chart patterns, confirming trends with indicators, and identifying key support and resistance levels.
- Example (continued): After identifying the pharmaceutical company, the trader would then examine its stock chart. They might wait for the price to pull back to a significant moving average or a strong support level, and then look for a bullish candlestick pattern or a positive MACD crossover to signal an opportune entry. Conversely, they might use technical resistance levels or bearish divergence in indicators to plan their exit.
This synergistic approach allows traders to align their long-term conviction (from fundamentals) with precise timing and risk management (from technicals). It helps avoid buying a fundamentally strong asset at an overextended price or selling a promising one prematurely due to short-term noise.
Choosing Your Analytical Lens
The choice between fundamental and technical analysis, or their combination, often depends on your individual trading style, investment goals, and risk tolerance:
- Long-Term Investors: Typically lean heavily on fundamental analysis to build conviction in their holdings, using technicals occasionally for opportunistic entries or risk management.
- Short-Term Traders (Day Trading, Scalping): Primarily rely on technical analysis, as rapid price movements and patterns are paramount. Fundamental news can still cause significant volatility, requiring awareness.
- Swing Traders: Often find a balanced combination most effective, using fundamentals to select assets for multi-day or multi-week trades and technicals to time their entries and exits.
Ultimately, mastering both disciplines provides a significant edge. By understanding both the intrinsic value and the market’s psychological pulse, you can develop a more resilient and adaptable trading strategy for the CFD market.
Frequently Asked Questions
What is the primary difference in focus between fundamental and technical analysis?
Fundamental analysis focuses on determining an asset’s intrinsic value by examining its underlying financial health, economic factors, and qualitative aspects. Technical analysis, conversely, concentrates on predicting future price movements by studying historical price charts, volume, and statistical indicators, assuming all relevant information is already reflected in the price.
Which analysis is generally better suited for long-term investing, and why?
Fundamental analysis is typically better suited for long-term investing because it provides a deep understanding of a company’s true worth and future growth potential based on its financials and market position. Long-term investors can use this insight to identify undervalued assets and ride out short-term market fluctuations.
Can fundamental and technical analysis contradict each other, and if so, how should a trader react?
Yes, they can contradict, especially in the short term, where a fundamentally strong company might show weak technical patterns due to temporary market sentiment or vice versa. A prudent trader should use such contradictions as a signal for further investigation, potentially waiting for alignment or using one analysis to confirm the other’s signals before making a decision.
Are there any common indicators or concepts that bridge both fundamental and technical analysis?
While distinct, some concepts can bridge both. For instance, high price volatility, often a technical indicator of risk, might signal underlying fundamental changes or uncertainty about a company’s future. Similarly, significant trading volume (technical) can indicate strong market interest driven by recent fundamental news.
Knowledge Check
1. Which of the following is a core principle of fundamental analysis?
- A) Price movements are random.
- B) All relevant information is reflected in the price.
- C) An asset has an intrinsic value that can be determined.
- D) Historical patterns guarantee future outcomes.
2. A trader primarily interested in identifying optimal entry and exit points for short-term trades would most likely rely on:
- A) Economic reports and company earnings.
- B) Balance sheets and income statements.
- C) Chart patterns and technical indicators.
- D) Macroeconomic forecasts and industry trends.
3. The most effective approach for comprehensive market analysis, especially in CFD trading, often involves:
- A) Exclusively using fundamental analysis to identify long-term trends.
- B) Relying solely on technical indicators for all trading decisions.
- C) Combining both fundamental and technical analysis to identify opportunities and time trades.
- D) Disregarding all forms of analysis and trading based on intuition.
Click to view the answers
1. C) – Fundamental analysis aims to determine an asset’s intrinsic value by assessing its underlying health and external factors.
2. C) – Technical analysis focuses on chart patterns and indicators to pinpoint short-term entry and exit points.
3. C) – The article emphasizes that combining both fundamental and technical analysis provides a more holistic and effective approach for informed trading decisions.