

Understanding Index CFDs: A Comprehensive Guide
Trading Contracts for Difference (CFDs) on stock market indices offers a dynamic way to engage with global financial markets. Unlike investing in individual stocks, index CFDs allow traders to speculate on the overall performance of a basket of companies, providing broad exposure to an economy, sector, or specific market theme. This guide delves into the mechanics, strategies, and essential considerations for trading index CFDs effectively.
Index CFDs allow traders to speculate on the price movements of a stock market index without owning the underlying assets. This leveraged product offers exposure to broad market trends, enabling both long and short positions.
What are Stock Market Indices?
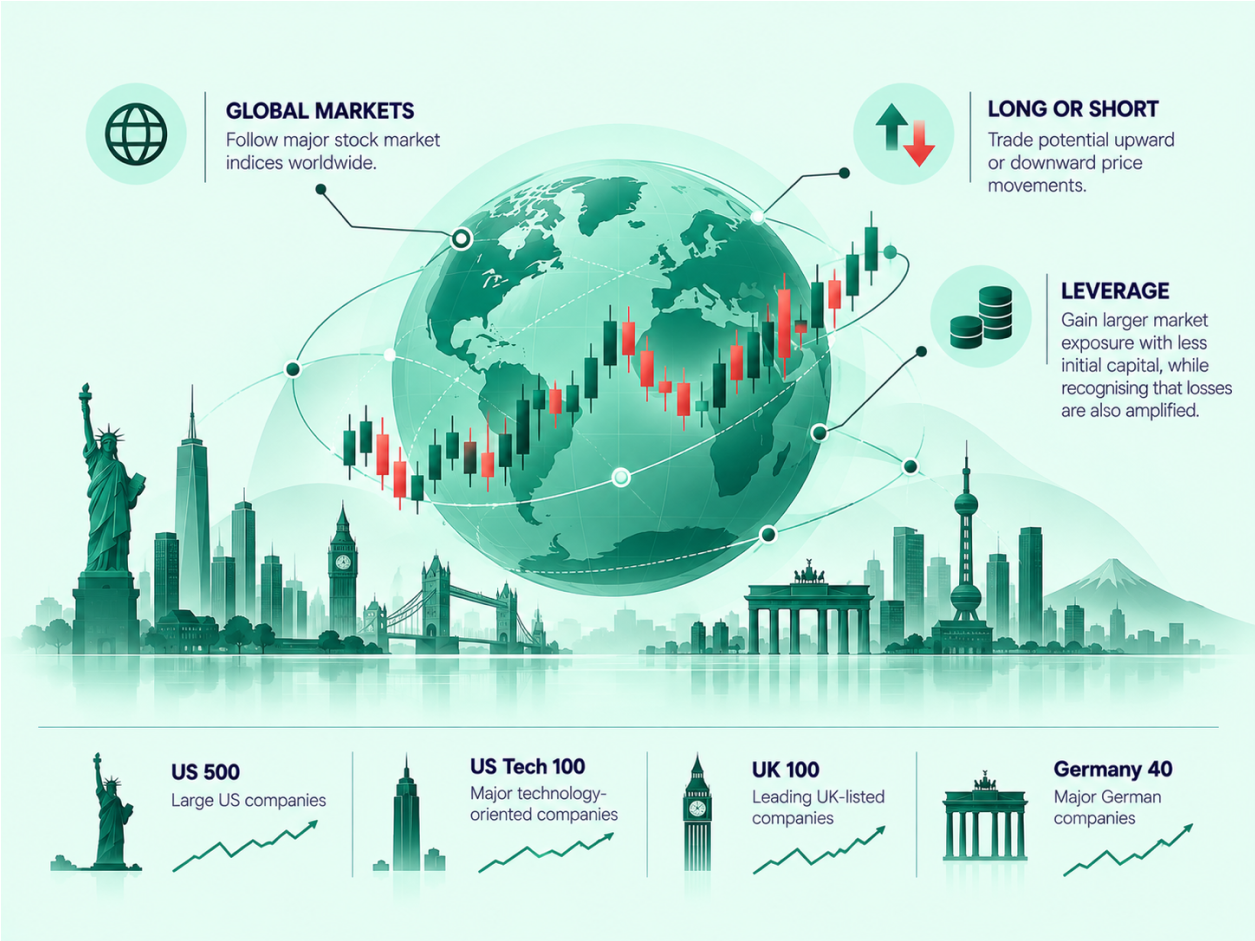
A stock market index is a benchmark that measures the performance of a selected group of assets, most commonly shares from a particular stock market, sector, or economy. Indices serve as barometers for market health, reflecting the collective sentiment and economic conditions influencing their constituent companies. For instance, the S&P 500 tracks 500 of the largest U.S. public companies, while the Nasdaq 100 focuses on major technology and growth companies.
Indices are typically calculated based on specific rules set by an index provider, determining which companies are included and how much influence each company has on the index price. Many major indices are market-capitalization weighted, meaning larger companies have a greater impact on the index’s movement.
While market-capitalization weighting is common, other methodologies exist. Price-weighted indices, such as the Dow Jones Industrial Average, give greater influence to companies with higher share prices, regardless of their total market value. Conversely, modified market-capitalization weighted indices, like the Nasdaq-100, adjust the influence of larger companies to prevent a few dominant stocks from disproportionately affecting the index, often by capping individual company weights or incorporating other factors.
Understanding an index’s weighting methodology is crucial, as a significant move in a heavily weighted constituent can disproportionately affect the entire index.
Types of Indices You Can Trade
Beyond broad national benchmarks, the world of stock market indices is diverse, offering various ways to gain exposure to specific market segments or themes. Understanding these different types can help traders refine their strategies and target particular market dynamics.
- Sector Indices: These indices track the performance of companies within a specific industry or sector, such as technology, banking, energy, or healthcare. Examples include the S&P 500 Information Technology Index or the Dow Jones U.S. Financials Index. Trading sector indices allows investors to speculate on the health and growth prospects of a particular industry, rather than the broader economy.
- Volatility Indices: Designed to measure the market’s expectation of future volatility, these indices are often referred to as “fear gauges.” The most well-known is the CBOE Volatility Index (VIX), which reflects implied volatility of S&P 500 index options. Traders use volatility indices to gauge market sentiment and potential for large price swings, often increasing during periods of market uncertainty.
- Currency Indices: A currency index measures the value of a single currency against a basket of other major currencies. The U.S. Dollar Index (DXY) is a prime example, tracking the dollar’s performance against currencies like the Euro, Yen, Pound, Canadian Dollar, Swedish Krona, and Swiss Franc. These indices are valuable for assessing the relative strength or weakness of a currency and its impact on global trade and asset prices.
How Index CFDs Work
A Contract for Difference (CFD) is a financial derivative that allows you to speculate on the rising or falling prices of fast-moving global financial markets, such as indices, without owning the underlying asset. When trading index CFDs, you enter into an agreement with a broker to exchange the difference in the price of an index from the time the contract is opened until it is closed.
Key characteristics of Index CFDs:
- Leverage: CFDs are leveraged products, meaning you only need to deposit a small percentage of the total trade value to open a position. This initial deposit is known as margin. While leverage can amplify potential profits, it also magnifies potential losses, as both are calculated based on the full value of the trade, not just your margin.
- Going Long or Short: Index CFDs enable traders to profit from both rising and falling markets. If you anticipate an index’s value to increase, you can “go long” (buy). Conversely, if you expect it to fall, you can “go short” (sell).
- No Ownership: You do not own any of the underlying shares or assets that comprise the index. You are simply speculating on its price movement.
- Flexibility: Index CFDs often offer extended trading hours compared to traditional stock exchanges, allowing for greater flexibility in responding to global market events.
Beyond CFDs: Other Ways to Gain Index Exposure
While Index CFDs provide a flexible and leveraged way to speculate on market movements, they are not the only instruments available for gaining exposure to stock market indices. Traders and investors can utilize several other financial products, each with distinct characteristics and use cases.
- Index Futures: A futures contract is an agreement to buy or sell an index at a predetermined price on a specified future date. Unlike CFDs, futures are standardized exchange-traded contracts. They are often used by institutional investors for hedging portfolios or by speculators taking a longer-term view on market direction. Futures contracts typically involve larger contract sizes and may require higher margin, but they offer direct exposure to the underlying index’s price discovery.
- Index Options: Options contracts give the holder the right, but not the obligation, to buy (call option) or sell (put option) an index at a specific price (strike price) on or before a certain expiry date. Options offer significant leverage and can be used for speculation, hedging, or income generation. Buyers of options have limited risk (the premium paid), while sellers face potentially unlimited risk.
- Index-tracking Exchange Traded Funds (ETFs): ETFs are investment funds that hold a basket of assets, such as stocks, designed to replicate the performance of a specific index. Traded on stock exchanges like individual shares, ETFs offer diversification and are generally considered a more suitable instrument for long-term investment rather than short-term speculation. They provide direct ownership of a diversified portfolio mirroring an index, without the leverage and overnight financing costs typically associated with CFDs.
Factors Influencing Index Prices
Index prices are highly responsive to a multitude of economic, political, and corporate events. Understanding these drivers is fundamental to successful index CFD trading:
- Macroeconomic Data: Key economic indicators like Gross Domestic Product (GDP) growth, inflation rates, unemployment figures, and manufacturing data can significantly impact investor confidence and, consequently, index performance. Positive data typically signals economic strength, potentially leading to an upward trend, while negative data can trigger declines.
- Central Bank Policies: Decisions by central banks regarding interest rates, quantitative easing, or tightening measures directly influence borrowing costs, corporate profitability, and overall market liquidity. Higher interest rates, for example, can dampen corporate earnings and make equity investments less attractive.
- Company Earnings: For market-cap weighted indices, the earnings reports of major constituent companies can have a substantial effect. Strong earnings from a few dominant firms can lift the entire index, even if other components are underperforming.
- Geopolitical Events: Global events such as elections, trade disputes, conflicts, or natural disasters can introduce uncertainty, leading to increased volatility and rapid price movements across indices.
- Market Sentiment: The collective psychological state of investors, often driven by news and speculation, plays a significant role. Positive sentiment can fuel rallies, while fear and panic can lead to sharp sell-offs.
Popular Index CFD Trading Strategies
Developing a robust trading strategy is crucial for navigating the index CFD market. Here are several widely used approaches:
Trend Trading
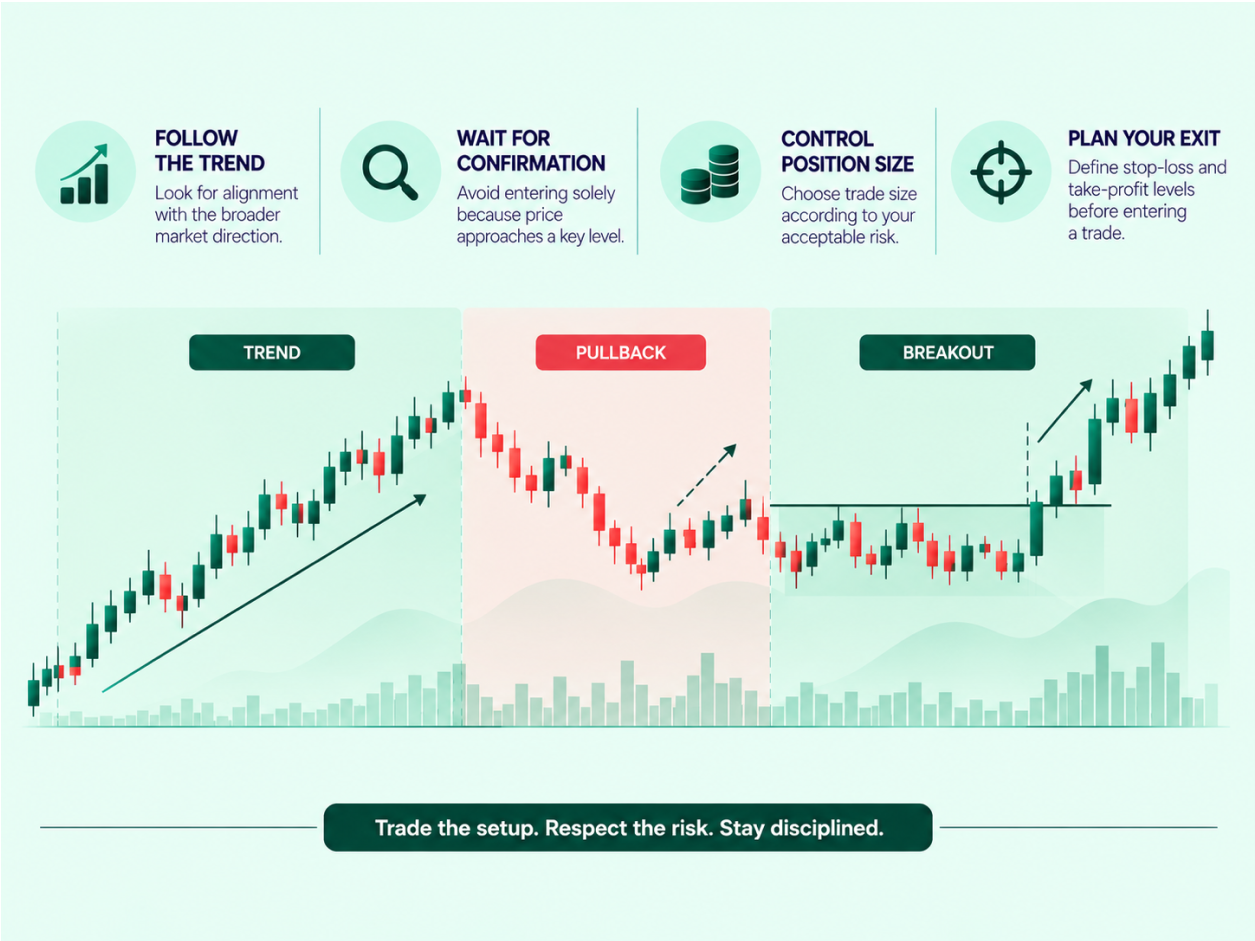
Trend trading involves identifying and following the prevailing direction of an index’s price movement. The goal is to enter a position early in a trend and exit when signs of reversal emerge.
- Application: If the S&P 500 CFD shows a consistent pattern of higher highs and higher lows, a trend trader might go long, using tools like moving averages (e.g., 50-day and 200-day) to confirm the trend’s direction. A crossover of a shorter-term moving average above a longer-term one often signals an uptrend.
- Example: A trader observes the Germany 40 CFD consistently breaking above previous resistance levels and its 50-period Exponential Moving Average (EMA) is above its 200-period EMA. They enter a long position, placing a stop-loss below a recent swing low and aiming to ride the upward momentum until the trend shows signs of weakening, perhaps indicated by the 50-period EMA crossing back below the 200-period EMA.
Retracement Trading
Markets rarely move in a straight line. Retracements are temporary pullbacks or corrections against the dominant trend. Retracement traders aim to enter a position when the price temporarily dips (in an uptrend) or rises (in a downtrend) before resuming its original direction.
- Application: In a strong uptrend, an index CFD might experience a temporary dip. A retracement trader would wait for this pullback to a key support level (e.g., a Fibonacci retracement level or a previous resistance-turned-support) and then enter a long position, anticipating the trend’s continuation.
- Example: The Nasdaq 100 CFD is in a clear uptrend but pulls back to its 38.2% Fibonacci retracement level. A retracement trader might place a buy order at this level, confirming with an oscillator like the Relative Strength Index (RSI) showing oversold conditions, expecting the rally to resume.
Reversal Trading
Reversal trading focuses on identifying a fundamental shift in the overall direction of an index’s price. This is distinct from a retracement, which is temporary.
- Application: A reversal might be signaled by chart patterns (e.g., Head and Shoulders, Double Top/Bottom), significant divergence between price and an oscillator (like MACD), or a break of a long-term trendline. If the FTSE 100 CFD, previously in an uptrend, starts forming lower highs and lower lows, a reversal trader might initiate a short position.
- Example: After a prolonged uptrend, the Dow Jones Industrial Average CFD forms a “double top” pattern, failing to make a new high and then breaking below the neckline support. A reversal trader would interpret this as a strong signal for a downtrend and open a short position.
Momentum Trading
Momentum traders capitalize on the speed and strength of price movements. The strategy is often summarized as “buy high, sell higher” or “sell low, buy lower.”
- Application: This strategy involves buying index CFDs that are showing strong upward momentum and selling them when they appear to be losing steam. Indicators like the RSI or Stochastic Oscillator can help identify overbought or oversold conditions, signaling potential shifts in momentum. Volume analysis is also critical to confirm the strength behind a price move.
- Example: The US 500 CFD suddenly surges on higher-than-average volume, indicating strong buying pressure. A momentum trader would enter a long position, aiming to capture the rapid upward move, and would exit once the momentum indicators like RSI start to flatten or turn down from overbought territory.
Breakout Trading
Breakout trading involves entering a position when an index CFD’s price moves decisively beyond established levels of support or resistance. These breakouts often signal the beginning of a new trend or a significant acceleration of an existing one.
- Application: Traders using this strategy monitor index CFDs for periods of consolidation or range-bound trading. When the price breaks above resistance (for a long position) or below support (for a short position) with increased volume, it suggests a strong conviction in the new direction.
- Example: The Hong Kong HS50 CFD has been trading within a narrow range for several days, forming clear support and resistance levels. A breakout trader places a buy-stop order just above the resistance level. When the price breaks through this resistance, the order is triggered, initiating a long position, anticipating a strong upward move.
Risk Management in Index CFD Trading
Given the leveraged nature of CFDs, robust risk management is paramount.
- Stop-Loss Orders: These are essential tools that automatically close your position if the market moves against you by a predetermined amount, limiting potential losses.
- Take-Profit Orders: These orders automatically close your position when the market reaches a specified profit level, helping to lock in gains.
- Position Sizing: Carefully determine the size of your trade relative to your account balance and risk tolerance. Never risk more than a small percentage of your capital on a single trade.
- Understanding Leverage: Always be aware that leverage amplifies both profits and losses. A small market movement against your position can lead to significant losses if not managed correctly.
- Trading Plan: Develop a clear trading plan that outlines your entry and exit criteria, risk parameters, and overall strategy. Stick to your plan to avoid emotional decision-making.
Choosing an Index to Trade
The “best” index to trade is subjective and depends on your individual trading style, risk appetite, and market knowledge. Consider the following:
- Index Characteristics: Research the constituent companies, sectors, and weighting methodology of potential indices. A technology-heavy index like the Nasdaq 100 will react differently to economic news than a broader market index like the S&P 500 or a small-cap index like the Russell 2000.
- Volatility: Different indices exhibit varying levels of volatility. The VIX (Volatility Index), for example, is specifically designed to track market volatility itself. Match the index’s typical volatility to your risk tolerance.
- Market Hours: Be aware of the trading hours of the underlying market. While CFDs often offer extended hours, liquidity might be lower outside of core market sessions.
- Economic Exposure: Choose an index that aligns with your view on a particular national economy, global sector, or basket of stocks. For instance, if you anticipate strong growth in the German economy, the DAX 40 might be a suitable choice.
Step-by-Step Index CFD Trading Process
- Select Your Index: Based on your research and market outlook, choose an index CFD that aligns with your trading objectives.
- Conduct Market Analysis: Utilize both fundamental analysis (economic data, news, earnings) and technical analysis (chart patterns, indicators) to form a trading hypothesis.
- Determine Direction and Timeframe: Decide whether you will go long or short, and establish your preferred trading timeframe (e.g., day trading, swing trading).
- Understand Trading Costs: Familiarize yourself with the spread (the difference between buy and sell prices), margin requirements, overnight financing charges, and any commissions. These costs impact your break-even point.
- Set Risk Management Parameters: Crucially, define your stop-loss and take-profit levels before entering a trade. Calculate your position size to ensure potential losses are within your acceptable limits.
- Place and Monitor Your Trade: Execute your trade according to your plan. Continuously monitor the position, adjusting your stop-loss or take-profit if market conditions or your analysis changes, but always adhere to your initial risk parameters.
- Review and Learn: After closing a trade, review its outcome against your original plan. A trading journal can help identify strengths and weaknesses in your strategy, fostering continuous improvement.
Trading index CFDs offers a powerful avenue for speculating on broad market movements. By understanding the underlying mechanics, applying disciplined strategies, and prioritizing robust risk management, traders can navigate these dynamic markets with greater confidence.
Frequently Asked Questions
What is the primary benefit of trading index CFDs compared to individual stocks?
The primary benefit of trading index CFDs is gaining diversified exposure to an entire market or sector through a single position, rather than relying on the performance of one company. This can help mitigate single-stock risk and allows speculation on broader economic trends.
How does leverage impact index CFD trading?
Leverage allows traders to open larger positions with a smaller initial capital outlay (margin), amplifying both potential profits and potential losses. While it increases market exposure, it also magnifies the risk, making robust risk management essential.
What are some key economic factors that influence index prices?
Key economic factors influencing index prices include macroeconomic data such as GDP, inflation, and employment figures, as well as central bank policies like interest rate decisions. Company earnings reports for major constituents and geopolitical events also play a significant role.
Can I trade index CFDs if I expect the market to fall?
Yes, one of the advantages of index CFDs is the ability to “go short,” meaning you can open a selling position if you anticipate the index’s price will decline. This allows traders to potentially profit from both upward and downward market movements.
Why is risk management particularly important when trading index CFDs?
Risk management is crucial for index CFDs due to their leveraged nature, which can magnify losses rapidly. Implementing stop-loss orders, carefully sizing positions, and adhering to a predefined trading plan are vital to protect capital and maintain trading discipline.
Knowledge Check
1. Which of the following is a key characteristic of trading index CFDs?
- A) Traders own a portion of the underlying companies in the index.
- B) Leverage allows traders to control a large position with a smaller initial deposit.
- C) Trading is only possible when the index is expected to rise.
- D) Index CFDs are primarily used for long-term investment rather than speculation.
2. A trader observes the S&P 500 CFD consistently making higher highs and higher lows. Which trading strategy would be most appropriate for this observation?
- A) Reversal Trading
- B) Breakout Trading
- C) Trend Trading
- D) Range Trading
3. What is the primary purpose of a stop-loss order in index CFD trading?
- A) To automatically lock in profits when a target price is reached.
- B) To increase the amount of leverage applied to a trade.
- C) To limit potential losses by automatically closing a position if the market moves unfavorably.
- D) To open a new position when the market breaks through a resistance level.
Click to view the answers
1. **B)** – Leverage is a defining feature of CFDs, allowing traders to gain exposure to a larger market position with a relatively small initial margin.
2. **C)** – Observing consistent higher highs and higher lows is a classic indicator of an uptrend, making trend trading the most suitable strategy.
3. **C)** – A stop-loss order is a critical risk management tool designed to mitigate potential losses by automatically closing a trade at a predetermined price if the market moves against the trader.