

The opening moments of a trading session often present a unique landscape of heightened activity, concentrated volatility, and significant trading opportunities. For day traders, understanding and strategically approaching these market opens can be a cornerstone of their intraday trading methodology. This guide explores the dynamics of market openings, outlining strategies to capitalize on the initial price action across various asset classes.
The market opening trading strategy is a day trading approach focused on leveraging the distinct price behavior and increased activity that occurs shortly after a financial market begins its session. It involves observing the initial price range to identify potential breakout, gap fading, or gap riding opportunities.
Why Market Opens Are Crucial for Traders
Measuring Market Volatility
While market opens are characterized by “heightened volatility,” understanding how this volatility is quantified and visualized is crucial for traders. Volatility, which describes the rate and magnitude of price changes over time, is fundamentally measured using statistical concepts like standard deviation. A higher standard deviation indicates greater price dispersion from the average, signifying increased volatility.
For practical application, traders commonly use technical indicators such as Bollinger Bands to gauge and interpret volatility levels. Bollinger Bands consist of a simple moving average (SMA) and two standard deviation bands plotted above and below the SMA. The width of these bands directly reflects the market’s volatility: wider bands suggest higher volatility, while narrower bands indicate lower volatility. During market opens, traders often observe a rapid expansion of Bollinger Bands, signaling the surge in price action and potential trading opportunities.
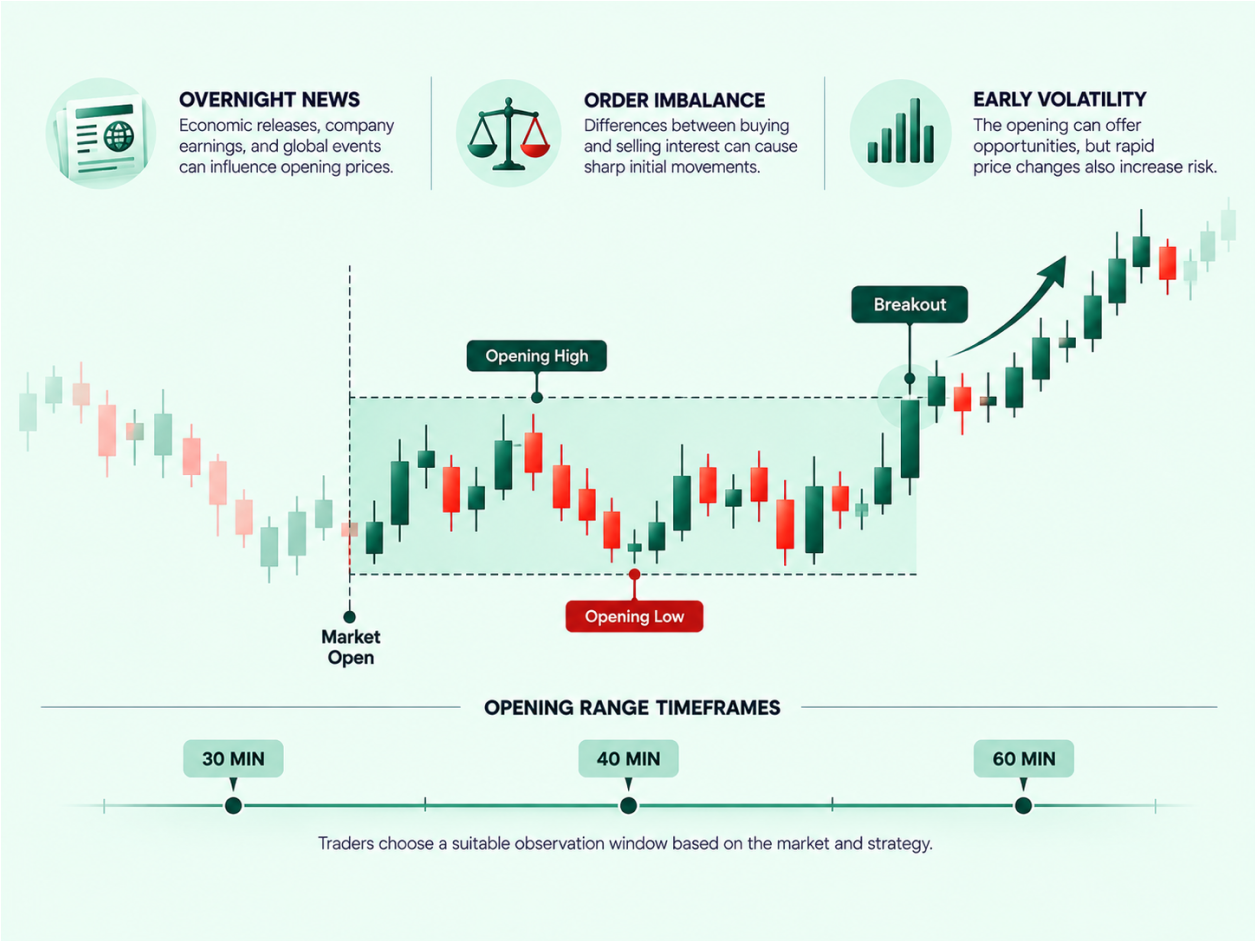
The first hour of trading is often characterized by pronounced price movements and elevated trading volumes. This surge in activity is driven by several factors:
- Digestion of Overnight News: Any economic data, geopolitical events, company earnings reports, or significant news that occurred while the market was closed is processed and priced in during the opening. This can lead to rapid adjustments in asset valuations.
- Order Imbalances: Institutional investors, hedge funds, and large individual traders often place substantial orders (buy or sell) before the market opens. These accumulated orders, when executed simultaneously at the open, can create significant supply/demand imbalances, causing sharp price shifts.
- Pre-Market Positioning: Traders who took positions in the pre-market or during other global sessions may adjust or close their trades, contributing to the initial volatility.
- Liquidity and Volatility: The confluence of these factors typically results in higher liquidity and increased volatility, offering day traders more opportunities for short-term speculation. While this can lead to greater profit potential, it also magnifies risk.
Understanding the Market Opening Trading Strategy
The core of the market opening strategy involves defining an “opening range” and then reacting to how price interacts with this range.
Defining the Opening Range
The opening range is typically established by marking the highest and lowest prices reached within a specific timeframe immediately following the market open. Common durations for this initial window include:
- 30 minutes: Often used for highly liquid U.S. markets like the S&P 500 futures, Nasdaq-100 futures, or individual stocks.
- 40 minutes: Frequently applied to European cash indices such as the DAX or FTSE 100, reflecting their typical early session dynamics.
- 60 minutes: Some traders prefer a slightly longer period to allow for more price consolidation, especially in less volatile instruments or for a broader perspective.
Once this range is established, the high and low points serve as critical reference levels for potential entry and exit signals.
Key Variants of the Strategy
There are three primary approaches to trading the market open:
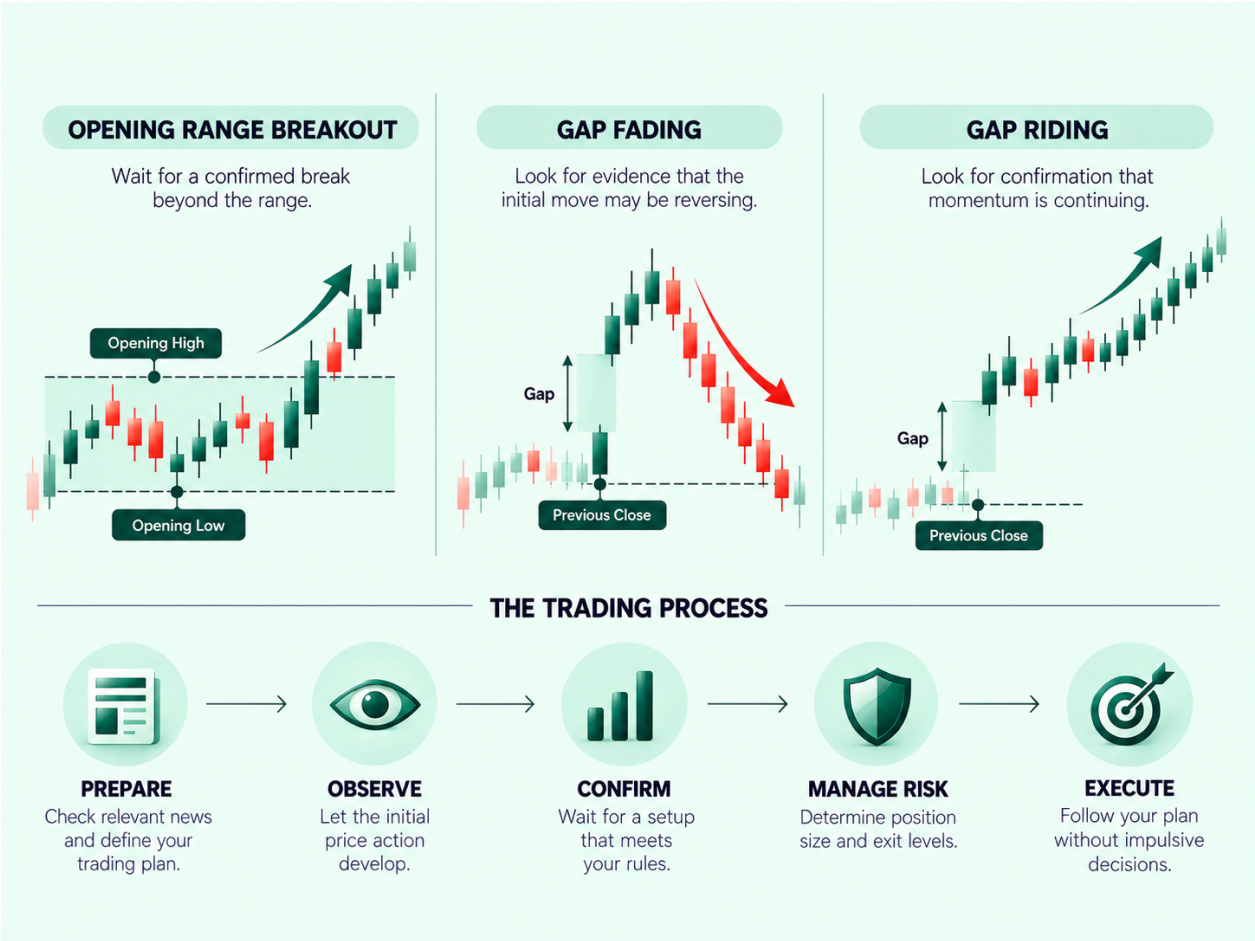
1. Open Range Breakout (ORB)
The Open Range Breakout strategy involves waiting for the price to move decisively above the opening range high or below the opening range low. This move is interpreted as a sign of strong directional momentum for the session.
- How it works: A trader identifies the high and low of the first 30-60 minutes. If the price then breaks above the opening range high, a long position might be initiated. Conversely, if it breaks below the opening range low, a short position could be considered.
- Example: Imagine the S&P 500 futures open at 4,500. Over the first 30 minutes, it trades between 4,495 (low) and 4,510 (high). If, after 30 minutes, the price surges past 4,510 to 4,512, an ORB trader might enter a long position, anticipating further upward movement. The stop-loss would typically be placed below the opening range high (e.g., 4,509 or 4,505).
2. Gap Fading
Gap fading is a mean-reversion strategy where traders anticipate that an opening price gap will partially or fully close. A gap occurs when the opening price is significantly different from the previous day’s closing price.
- How it works: If a market opens with a notable gap up (e.g., 0.5% to 1.5% above the previous close), a gap fading trader might look for signs of weakness and enter a short position, expecting the price to retrace towards the previous day’s close. Conversely, if it opens with a gap down, they might look for a long entry.
- Example: A tech stock closes at $100 on Monday. Due to positive overnight news, it opens Tuesday at $103. A gap fading trader might observe the initial upward momentum fading and enter a short position at $102.50, targeting a move back towards $100. A stop-loss would be placed above the opening high (e.g., $103.50).
3. Gap Riding
In contrast to gap fading, gap riding (or gap continuation) involves trading in the direction of the opening gap, assuming the momentum that caused the gap will continue.
- How it works: If a market opens with a significant gap up, and the initial price action confirms strong buying pressure, a gap riding trader would enter a long position. If it opens with a gap down and selling pressure persists, they would enter a short position.
- Example: A commodity like Crude Oil closes at $75 per barrel. Overnight, major supply disruptions are reported, causing it to open at $78. If the price continues to climb to $78.50 with strong volume, a gap riding trader might enter a long position, anticipating the news-driven momentum to push prices higher. The stop-loss would be placed below the opening low or a recent support level.
Implementing the Market Opening Trading Strategy
A structured approach is essential to navigate the fast-paced environment of market opens.
1. Preparation
Before the market opens, conduct thorough research:
- Identify Target Markets: Select highly liquid instruments with clearly defined session opens, such as major stock indices (e.g., S&P 500, Nasdaq-100, DAX), active forex pairs (e.g., EUR/USD, GBP/USD), or heavily traded shares.
- Check Economic Calendar & News: Be aware of any scheduled economic releases, earnings reports, or geopolitical events that could impact your chosen market. These are primary drivers of opening volatility.
- Define Opening Range Duration: Decide on the specific timeframe (e.g., 30, 40, or 60 minutes) you will use to establish your opening range for each market.
2. Patience and Observation
The initial minutes can be highly erratic. Resist the urge to enter immediately:
- Wait for Range Formation: Allow the chosen opening range period to fully develop. This helps filter out early “noise” and provides a more reliable reference point.
- Monitor Price Action: Observe how price behaves within the opening range. Is it consolidating? Is there a clear bias?
3. Confirmation and Entry
Once the opening range is established, look for your chosen strategy’s specific entry triggers:
- ORB: Wait for a confirmed break above the opening high or below the opening low, ideally accompanied by increased volume.
- Gap Fading: Look for signs that the initial gap momentum is fading (e.g., reversal candlesticks, declining volume in the direction of the gap) before entering against the gap.
- Gap Riding: Confirm that the momentum driving the gap is sustained, often with strong volume, before entering in the direction of the gap.
4. Robust Risk Management
Given the heightened volatility, stringent risk management is paramount:
- Stop-Loss Orders: Always place a stop-loss order immediately upon entering a trade. For ORB, a stop-loss might be just inside the opening range (e.g., below the breakout level for a long trade). For gap fading, it could be beyond the extreme of the gap.
It’s important to note that standard stop-loss orders are not guaranteed, especially in highly volatile conditions like those found at market opens. Rapid price movements, wider spreads, or fast reversals can lead to execution price discrepancies, where your order is executed at a price worse than your specified stop-loss level. To mitigate this, some brokers offer Guaranteed Stop-Loss Orders (GSLOs). While GSLOs ensure your trade closes at the exact price you set, they typically incur a fee if activated, which should be factored into your risk calculations.
- Take-Profit Orders: Define your profit targets before entering. This could be a fixed risk-to-reward ratio (e.g., 1:1 or 1:2), a key support/resistance level, or the previous day’s close for gap fading.
- Average True Range (ATR): ATR is an excellent tool for setting dynamic stop-loss and take-profit levels. It measures recent volatility, allowing you to adjust your exit points based on the market’s current behavior rather than fixed pip or point values. For instance, you might set a stop-loss at 1.5 times the current ATR value from your entry.
- Position Sizing: Adjust your position size to ensure that even if your stop-loss is hit, the loss is within your predetermined risk tolerance (e.g., 1-2% of your trading capital).
- Time-Based Exits: If neither your stop-loss nor your take-profit is hit by a certain time (e.g., midday or end of the first few hours), consider closing the position to avoid holding during potentially quieter, less profitable conditions.
5. Consider Global Session Overlaps
The market opening strategy isn’t limited to a single session. Savvy traders often apply this approach multiple times throughout the day by monitoring the opens of different major global trading sessions. For instance, after observing the local market open in the morning, a trader might then focus on the New York market open in the afternoon. The opening of a major market, such as the U.S. session, can significantly influence instruments in other regions, even European ones, due to interconnected global markets and the flow of capital. This provides additional trading opportunities as new waves of liquidity and volatility enter the market.
Markets Suited for Trading Opens
While adaptable, the strategy performs best in markets exhibiting clear session opens and sufficient liquidity:
- Major Stock Indices (CFDs): Markets like the S&P 500, Nasdaq-100, DAX, and FTSE 100 often react sharply to overnight news and have distinct opening hours, making them prime candidates.
- Active Forex Pairs (CFDs): While forex trades 24/5, specific “opens” like the London or New York session openings often see increased volatility, especially around major economic data releases. Non-major (cross) and exotic pairs can exhibit higher volatility due to lower liquidity.
- Highly Liquid Shares (CFDs): Individual stocks, particularly those with recent news or earnings reports, can experience significant opening gaps and breakouts.
- Commodities (CFDs): Energies (e.g., Crude Oil) and precious metals (e.g., Gold) can be highly volatile at market opens, especially in response to geopolitical events or supply/demand news.
Complementary Tools and Techniques
To enhance the market opening strategy, consider integrating these analytical tools:
- Volume: High volume accompanying a breakout or gap continuation adds conviction to the move. Low volume might suggest a false breakout or weakening momentum.
- Volume-Weighted Average Price (VWAP): VWAP provides a dynamic intraday average price, weighted by volume. Traders can use it as a reference point; price trading above VWAP might indicate bullish sentiment, while below suggests bearishness.
- Session Indicators: These can visually highlight the opening range and other key session levels on your chart.
Advantages and Disadvantages
Advantages
- Clarity and Structure: Provides a defined time window, clear price levels, and a framework for entries and exits.
- Focus: Allows traders to concentrate on a specific, often highly active, period, potentially reducing overall screen time.
- Short Holding Periods: Ideal for day traders who prefer to avoid overnight exposure and associated risks.
- Flexibility: Adaptable across various liquid asset classes with meaningful session opens.
Disadvantages
- Heightened Volatility: The opening period can be extremely erratic, leading to rapid price reversals and increased risk of stop-loss triggers.
- False Breakouts: Prices can often fake a breakout from the opening range before reversing, trapping impatient traders.
- Not Every Session is Tradable: Some days may remain range-bound or lack clear direction at the open, offering no viable setups.
- Requires Real-Time Attention: Fast price action demands quick decision-making and execution, which can be challenging, especially in volatile conditions. Wider spreads or slippage can also affect outcomes.
Frequently Asked Questions
What is the primary goal of the market opening trading strategy?
The primary goal is to identify and capitalize on potential intraday trading opportunities that arise from the concentrated volatility and increased liquidity at the start of a market session. Traders use it to capture momentum from overnight news, trade opening gaps, or assess the session’s early direction.
How do I determine the best opening range duration for my trades?
The optimal opening range duration often depends on the specific market and its typical volatility profile. For U.S. indices, 30 minutes is common, while European indices might use 40 minutes. Experiment with different durations and backtest to find what works best for your chosen instrument.
Can this strategy be applied to all financial markets?
While adaptable, this strategy tends to work best in liquid markets with clearly defined session opens, such as major stock indices, active forex pairs, and heavily traded shares. It may be less reliable in thinly traded markets where price action can be more sporadic and less predictable.
What are the main risks associated with trading market opens?
Key risks include false breakouts, rapid price reversals, and sessions that lack clear direction. Entering a trade before the opening range is fully formed or using static stop-loss settings that don’t account for current volatility can also lead to significant losses.
Knowledge Check
1. Which of the following is NOT a primary reason for heightened volatility at market opens?
- A) Digestion of overnight news
- B) Accumulation of institutional orders
- C) Reduced liquidity due to fewer participants
- D) Pre-market positioning adjustments
2. A trader observes a stock opening 2% lower than its previous close. Believing this initial move is overdone and the price will recover, they enter a long position. Which market opening strategy are they most likely employing?
- A) Open Range Breakout
- B) Gap Riding
- C) Gap Fading
- D) Time-Based Exit
3. What role does Average True Range (ATR) play in the market opening trading strategy?
- A) It helps define the opening range duration.
- B) It measures recent volatility to help set dynamic stop-loss and take-profit levels.
- C) It confirms the direction of an opening gap.
- D) It indicates the volume of trades at the market open.
Click to view the answers
1. **C)** – Heightened volatility at market opens is typically associated with *increased* liquidity and participation, not reduced liquidity.
2. **C)** – Gap fading involves trading against an opening gap, anticipating a reversion towards the previous close.
3. **B)** – ATR is used to measure market volatility, which helps traders set stop-loss and take-profit levels that are appropriate for the current market conditions.