


Market volatility gapping represents a critical phenomenon for traders, particularly those utilizing Contracts for Difference (CFDs). It occurs when an asset’s price experiences a sudden, significant jump or drop, leaving a visible “gap” on the chart where little or no trading activity took place. This abrupt price dislocation is a direct manifestation of heightened market volatility, often presenting both substantial opportunities and considerable risks.
Market volatility gapping refers to instances where an asset’s price experiences a significant, rapid movement (a gap) from one trading period to the next, often driven by sudden shifts in market sentiment or news, indicative of high volatility. This phenomenon highlights moments of intense price variability and can significantly impact trading outcomes.
Understanding the dynamics of gapping, its underlying causes, and the various types of gaps is fundamental for developing robust trading strategies. For CFD traders, who can profit from both rising and falling markets and utilize leverage, navigating these volatile events effectively is paramount to managing risk and identifying potential profit avenues.
Understanding Market Gaps and Volatility
A gap is a blank space on a price chart, indicating that a security’s price has moved sharply up or down without any transactions occurring at the intermediate price levels. This typically happens between the closing price of one trading session and the opening price of the next, or during periods of continuous trading in highly liquid markets like Forex, albeit less visibly on shorter timeframes.
Volatility, on the other hand, is a statistical measure of the degree of price variability of an asset over a given period. High volatility signifies rapid and extensive price swings, while low volatility suggests more stable, gradual price movements. When high volatility converges with specific market events, it often results in gapping.
What Causes Gaps?
Advanced Volatility Metrics for Traders
While the basic definition of volatility helps understand rapid price movements, advanced metrics offer a more granular view, crucial for anticipating and reacting to market gaps.
-
Beta: This metric measures an asset’s volatility relative to the overall market (typically represented by an index like the S&P 500). A beta greater than 1 indicates the asset is more volatile than the market, while a beta less than 1 suggests it’s less volatile. For instance, a stock with a beta of 1.5 is expected to move 1.5% for every 1% move in the market. High-beta assets are more prone to significant price swings and thus, larger gaps.
-
VIX (Cboe Volatility Index): Often dubbed the “fear index,” the VIX measures the market’s expectation of future volatility based on S&P 500 index options. A rising VIX typically signals increasing investor anxiety and an expectation of greater market turbulence, which can precede or accompany widespread gapping events across various assets. Traders monitor the VIX for clues about overall market sentiment and potential for heightened volatility.
-
Historical vs. Implied Volatility:
- Historical Volatility (or Realized Volatility) measures how much an asset’s price has fluctuated in the past over a specific period. It’s calculated from past price data.
- Implied Volatility is derived from the prices of options contracts and represents the market’s forecast of future volatility. It reflects the consensus expectation of how much an asset’s price will move.
Understanding these distinctions is vital: historical volatility tells us what has happened, while implied volatility gives a forward-looking perspective on what might happen. A significant divergence between the two can signal an impending shift in market dynamics, potentially leading to gap formations as new information is priced in.
Gaps are primarily triggered by factors that create an imbalance between buying and selling pressure so intense that the market cannot find equilibrium at previous price levels. These causes can be broadly categorized:
- Fundamental Factors: Unexpected news releases are the most common catalyst. This includes company earnings reports exceeding or missing expectations, economic data releases (e.g., inflation, employment figures), central bank announcements, geopolitical events, or even significant analyst upgrades/downgrades. Such news can cause a flood of buy or sell orders that overwhelm the market’s ability to process them smoothly.
- Technical Factors: A price breaking through a key support or resistance level can sometimes trigger algorithmic trading systems to place large orders, leading to a gap. For instance, if a stock breaks above a multi-year high, automated systems might initiate massive buy orders, causing the next available price to be significantly higher.
- Liquidity Imbalances: In markets with lower trading volume or during off-hours, even moderate news can lead to substantial gaps. With fewer participants to absorb large orders, prices can move more dramatically. For example, a major financial announcement released after the main trading session closes could cause a stock to open significantly higher or lower the next day.
- Continuous Trading Gaps: While less common in 24/5 markets like Forex, gaps can still occur on shorter timeframes (e.g., 1-minute charts) during periods of extreme volatility or specific news events, where bid-ask spreads widen dramatically, and price jumps occur.
Classifying Market Gaps for Strategic Trading
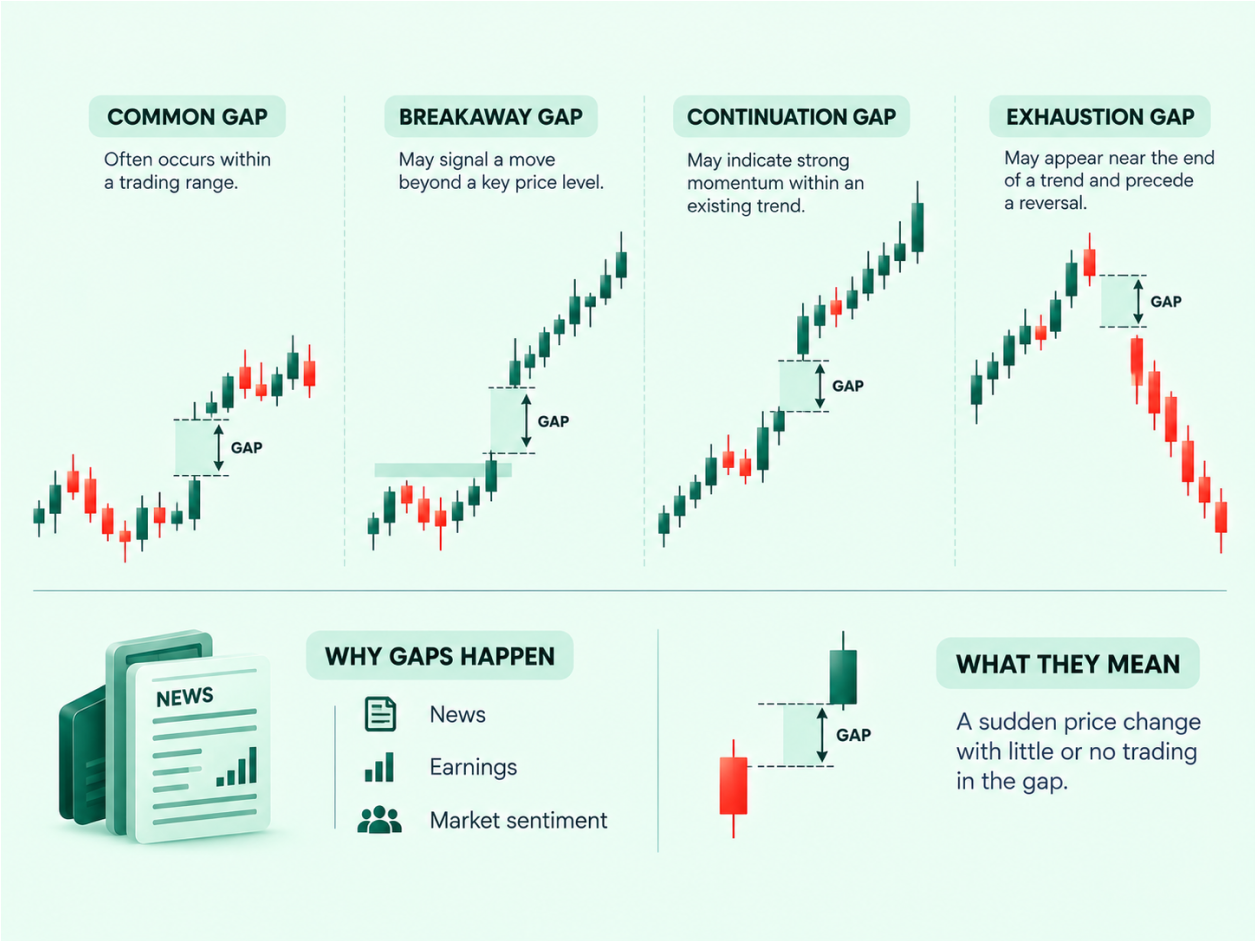
Not all gaps carry the same implications. Technical analysis categorizes gaps into four main types, each offering different insights into potential future price action:
1. Common Gaps
Common gaps are the most frequent and least significant. They typically occur within a trading range or sideways market, often due to routine overnight news or minor events. They don’t signal a major trend change and are usually filled relatively quickly.
- Example: A technology stock trading between $98 and $102 might close at $100 on Monday. Due to a minor positive news item about a competitor, it opens at $101.50 on Tuesday. This small gap is likely to be filled as the market digests the news and returns to its established range.
- Trading Implication: Common gaps are often faded, meaning traders bet on the price returning to fill the gap.
2. Breakaway Gaps
Breakaway gaps occur when the price breaks out of a consolidation pattern (like a triangle, rectangle, or head and shoulders) with significant momentum. They signal the beginning of a new, strong trend and are typically accompanied by high trading volume. These gaps are less likely to be filled, as they represent a decisive shift in market sentiment.
- Example: A pharmaceutical company’s stock has been consolidating for months. Upon announcing groundbreaking clinical trial results, it gaps up from $50 to $58 on exceptionally high volume, breaking above its long-term resistance. This breakaway gap suggests a new bullish trend has begun.
- Trading Implication: Traders often look to enter positions in the direction of the gap, anticipating a sustained trend.
3. Continuation Gaps (Runaway Gaps)
Continuation gaps, also known as runaway gaps, appear in the middle of an existing trend. They indicate a strong conviction among buyers or sellers, suggesting that the current trend has further to run. Like breakaway gaps, they are often accompanied by strong volume and are generally not filled quickly.
- Example: A commodity CFD, already in a strong uptrend, gaps up from $70 to $73 after a report indicates unexpected supply shortages. This gap confirms the existing bullish momentum, suggesting the price will continue its ascent.
- Trading Implication: These gaps reinforce the existing trend, prompting traders to hold or add to their positions in the trend’s direction.
4. Exhaustion Gaps
Exhaustion gaps occur near the end of a prolonged trend and signal a final surge of buying or selling pressure before a reversal. They are often characterized by high volume initially, followed by a rapid decline in momentum. These gaps are very likely to be filled, as they represent the last gasp of the prevailing trend.
- Example: After a relentless rally, a cryptocurrency CFD gaps up from $4,800 to $5,000, attracting a final wave of speculative buyers. However, volume quickly dissipates, and the price struggles to maintain the new high, eventually falling back to $4,800 and below. This could be an exhaustion gap.
- Trading Implication: Traders often look to fade exhaustion gaps or prepare for a trend reversal, potentially taking counter-trend positions.
The Dynamics of Gap Filling
Real-World Gap Analysis: An Illustrative Example
To bring these concepts to life, consider a hypothetical stock, “TechInnovate Inc.” (TINV), over several months:
Imagine TINV’s chart shows a period of consolidation, followed by a bullish engulfing candlestick pattern, suggesting a potential reversal from a downtrend. The very next day, TINV’s stock price gaps up significantly on high volume, breaking above its consolidation range. This is a classic breakaway gap, signaling the start of a new, strong uptrend. Traders who identify this might enter long positions, anticipating further upside.
A few weeks later, as TINV continues its rally, it experiences another gap up in the middle of the trend, again on strong volume. This is a continuation (runaway) gap, reinforcing the existing bullish momentum and suggesting the trend has more room to run.
However, after an extended rally, TINV’s price makes a final, dramatic gap up, but this time, the initial high volume quickly fades, and the price struggles to maintain its gains, eventually falling back into the gap. This is a tell-tale exhaustion gap, indicating that buying pressure is waning and a reversal is likely. The gap quickly fills, and the price continues to decline. Interestingly, the level where the exhaustion gap was filled later acts as a strong resistance point, demonstrating how filled gaps can become significant future technical levels.
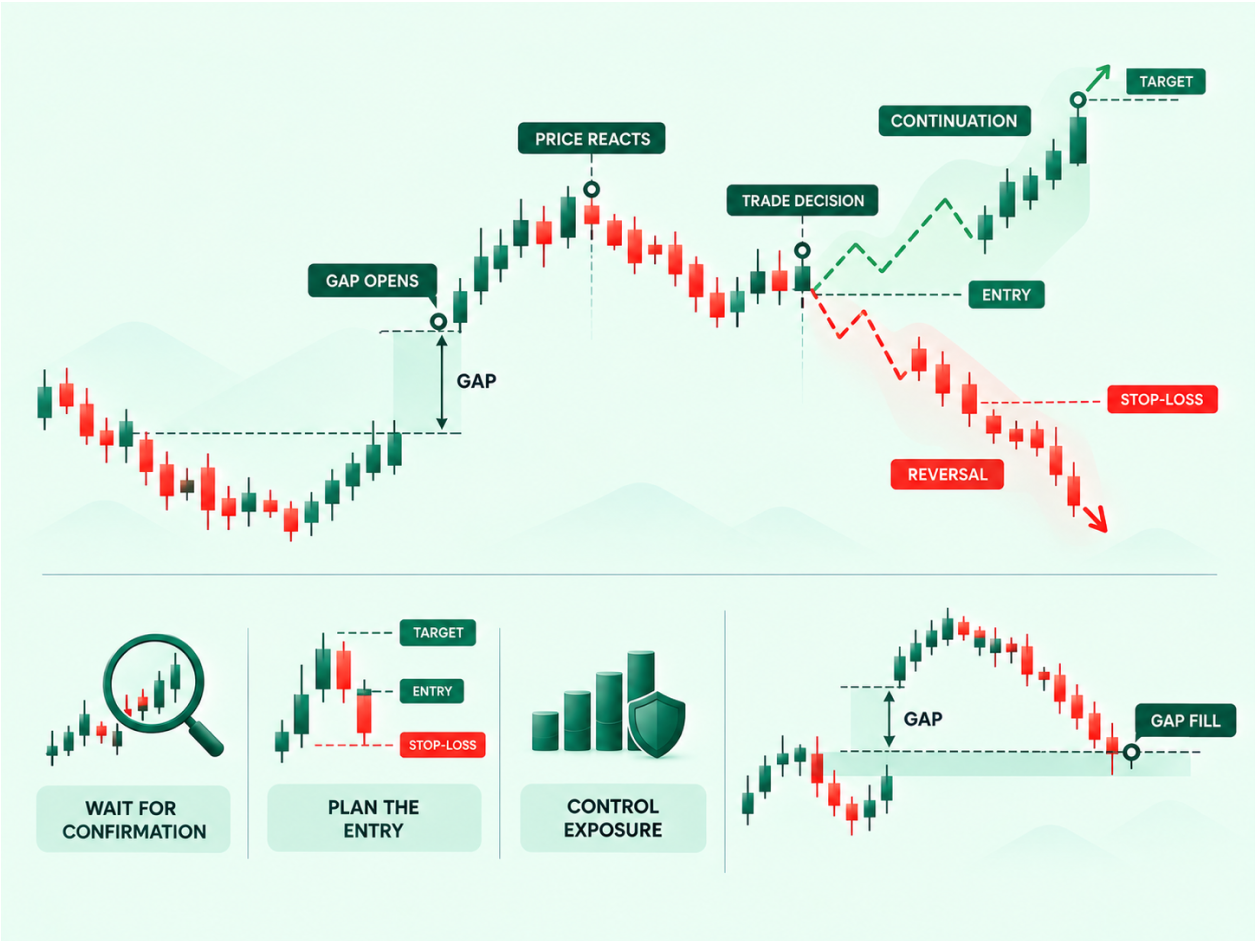
A gap is considered “filled” when the price returns to the levels traded before the gap occurred. This phenomenon is quite common and can be attributed to several factors:
- Irrational Exuberance/Pessimism: Initial price moves that create gaps can sometimes be an overreaction to news. As the market processes the information more rationally, prices may correct back to more sustainable levels, thus filling the gap.
- Absence of Support/Resistance: When a price gaps, it often moves past previous support or resistance levels without establishing new ones. This “vacuum” can make it easier for the price to retrace its steps.
- Psychological Levels: The pre-gap price level can act as a psychological magnet. Traders who missed the initial move, or those who profited and are taking profits, might drive the price back to these familiar zones.
- Gap Type: As noted, common and exhaustion gaps have a higher probability of being filled, while breakaway and continuation gaps are less likely to be filled quickly, as they signify stronger underlying conviction.
“Fading the gap” refers to a strategy where traders take a position opposite to the initial gap direction, anticipating that the price will revert to fill the gap, often within the same trading day. This is a high-risk, high-reward strategy frequently employed by day traders during periods of high volatility, such as earnings season.
Strategies for Trading Market Volatility Gapping with CFDs
Trading gaps requires a nuanced approach, combining technical analysis with strong risk management. CFDs offer flexibility, allowing traders to go long or short, which is advantageous for both gap-up and gap-down scenarios.
1. Anticipating a Gap
This strategy involves taking a position before a potential gap-inducing event. Traders might buy a CFD if they anticipate positive news (e.g., strong earnings) or sell a CFD if they expect negative news.
- Actionable Steps:
- Identify upcoming high-impact events (earnings, economic reports).
- Analyze historical reactions of the asset to similar events.
- Consider the prevailing trend and technical setup.
- Enter a position with a tight stop-loss, acknowledging the significant overnight risk.
- Example: A trader believes a tech company will announce stellar quarterly earnings. Before the market closes, they open a long CFD position on the stock, hoping for a significant gap up at the next open. If the earnings are indeed positive, the stock gaps higher, and the trader can close for a quick profit.
2. Trading in the Direction of the Gap (Momentum Trading)
For breakaway and continuation gaps, the initial gap often signals the start or continuation of a strong trend. Traders aim to enter a position in the direction of the gap, riding the momentum.
- Actionable Steps:
- Confirm the gap type (high volume for breakaway/continuation).
- Wait for a slight pullback after the open, or for the price to consolidate above/below the gap level, to get a better entry.
- Place a stop-loss below the gap’s low (for a gap up) or above the gap’s high (for a gap down).
- Example: A major index CFD gaps up significantly after positive economic data. A trader waits for the initial surge to stabilize, then enters a long position as the price continues its upward trajectory, setting a stop-loss just below the bottom of the gap.
3. Fading the Gap (Counter-Trend Trading)
This strategy is typically applied to common and exhaustion gaps, where the expectation is that the price will revert to fill the gap.
- Actionable Steps:
- Identify a common or exhaustion gap (often characterized by lower volume for common gaps, or extreme volume followed by reversal signs for exhaustion gaps).
- Wait for confirmation of price rejection at the new high/low, perhaps using candlestick patterns or oscillators.
- Enter a counter-trend CFD position (short for a gap up, long for a gap down) with a target near the pre-gap price level.
- Example: A small-cap stock CFD gaps up on a minor, speculative news report. A seasoned trader, recognizing it as a potential common gap, waits for the initial buying frenzy to subside and for the price to show signs of weakness. They then open a short CFD position, targeting the pre-gap closing price.
4. Trading After a Gap Fill
Sometimes, the most reliable opportunity arises after a gap has been filled. The original gap level can then act as a significant support or resistance zone.
- Actionable Steps:
- Monitor assets where gaps have been filled.
- Observe how the price reacts upon retesting the filled gap level.
- If the filled gap level holds as support (after a gap down that filled) or resistance (after a gap up that filled), consider entering a position in the direction of the bounce or rejection.
- Example: A currency pair CFD gaps down, but then quickly fills the gap. The trader observes the price returning to the original support level before the gap. If the price bounces strongly off this level, confirming it as new support, the trader might enter a long CFD position.
Managing Risk in Volatile Gapping Markets
Practical Considerations for Gap Trading
Beyond classifying gaps and understanding their filling dynamics, successful gap trading requires practical insights into market behavior:
- Gap Filling Momentum: When a price begins to fill a gap, it often doesn’t stop easily. The absence of immediate support or resistance levels within the gapped-out zone means there’s little to impede the price’s movement until it reaches the pre-gap levels. This can lead to rapid gap fills, making quick decision-making crucial.
- Market Participant Influence: While retail investors might exhibit “irrational exuberance” or panic, institutional investors and sophisticated algorithmic trading systems also play a significant role in gap formation and filling. Their large order flows can exacerbate initial moves or drive corrections, making it essential to observe price action carefully rather than solely relying on initial sentiment.
- Volume Confirmation is Key: Always confirm gap types with trading volume. Breakaway gaps, signaling new trends, should ideally be accompanied by high volume, indicating strong conviction. Conversely, exhaustion gaps, which precede reversals, might show high initial volume that quickly dissipates, or lower volume overall, suggesting a lack of sustained interest. Low volume for common gaps reinforces their less significant nature.
Trading gaps, especially with CFDs, inherently involves higher risk due to magnified volatility and potential for slippage.
- Leverage Amplification: CFDs allow trading with leverage, which amplifies both profits and losses. A small adverse price movement during a gap can lead to significant losses, potentially exceeding initial margin. Always understand your leverage and margin requirements.
- Slippage: During highly volatile gapping events, orders may not be executed at the desired price. A stop-loss order placed at $100 might be filled at $98 if the market gaps down past your stop, leading to a larger-than-expected loss. Some brokers offer guaranteed stop-loss orders (GSLOs), which ensure your trade is closed at the exact price you specify, even if the market gaps. Be aware that these typically come with a wider spread or a premium. LQH Markets does not currently provide GSLOs. Be aware that standard stop-loss orders may be subject to slippage, especially during volatile market conditions or market gaps, meaning trades might be closed at a price different from the specified stop-loss level.
- Position Sizing: Adjust your position size to reflect the increased risk. Trade smaller sizes during volatile periods to limit potential losses.
- Market Hours: Be aware of market closing times and upcoming news events. Gaps are most common overnight or during major announcements.
- Continuous Monitoring: For intraday gap trading, constant monitoring is essential to react swiftly to changing market conditions.
By combining a thorough understanding of gap types, their causes, and robust risk management practices, CFD traders can approach market volatility gapping with greater confidence and strategic insight.
Frequently Asked Questions
What is the primary cause of market volatility gapping?
Market volatility gapping is primarily caused by sudden, significant imbalances between buying and selling pressure, often triggered by unexpected news events such as earnings reports, economic data releases, or geopolitical developments, especially when combined with low liquidity.
How do different types of gaps inform trading decisions?
Different gap types offer distinct insights: breakaway gaps signal new trends, continuation gaps reinforce existing trends, common gaps are often filled quickly, and exhaustion gaps suggest an impending trend reversal. Identifying the type helps traders determine whether to trade with or against the gap’s initial direction.
Is gap trading suitable for all traders?
Gap trading is generally considered a high-risk strategy due to its association with high volatility and potential for significant price movements. It is best suited for experienced traders with a robust risk management plan, a deep understanding of technical analysis, and the ability to react quickly to market changes.
What are the main risks associated with trading gaps using CFDs?
The main risks include amplified losses due to leverage, significant slippage where orders are executed at prices worse than expected, and the challenge of accurately predicting the direction and sustainability of a gap. These risks necessitate careful position sizing and the use of protective stop-loss orders.
Can gaps occur in the forex market?
Yes, gaps can occur in the forex market, although they are often less pronounced on short-term charts due to its 24/5 continuous trading nature. They are most commonly seen over weekend breaks or during major economic news releases that cause significant shifts in currency valuations, leading to price jumps or drops.
Knowledge Check
1. Which type of gap typically signals the beginning of a new, strong trend and is often accompanied by high trading volume?
- A) Common Gap
- B) Exhaustion Gap
- C) Breakaway Gap
- D) Continuation Gap
2. What does “fading the gap” primarily involve?
- A) Trading in the direction of the initial gap movement.
- B) Taking a position opposite to the initial gap movement, expecting the price to revert.
- C) Waiting for the gap to fill completely before entering a position.
- D) Ignoring the gap and focusing on long-term trends.
3. Why is slippage a significant risk when trading market volatility gapping with CFDs?
- A) Leverage prevents orders from being executed at the desired price.
- B) High volatility can cause prices to jump past stop-loss levels, leading to worse execution prices.
- C) CFD brokers intentionally widen spreads during gapping events.
- D) Gaps only occur in illiquid markets where slippage is guaranteed.
Click to view the answers
1. **C)** – Breakaway gaps occur when the price breaks out of a consolidation pattern with significant momentum, signaling a new trend.
2. **B)** – Fading the gap means taking a position against the initial gap direction, anticipating that the price will revert to fill the gap.
3. **B)** – High volatility during gapping events can cause prices to move so rapidly that stop-loss orders are executed at a price significantly different (worse) than intended, known as slippage.